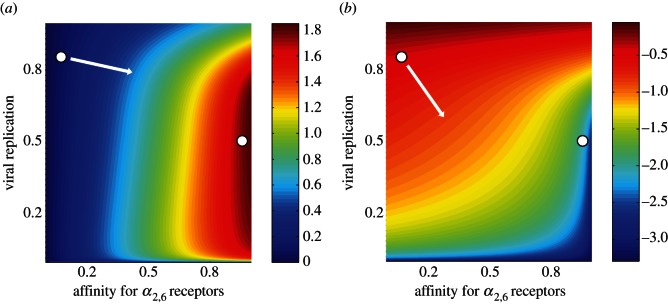
Figure 2.

Contour plots in phenotype space showing (a) R0 value and (b) log10 case fatality for the different phenotypes in the model. The axes show affinity for α2,6 receptors (j index, horizontal axis) and level of viral replication (k index, vertical axis) and are scaled from 0 to 1. The basic reproductive number R0 is calculated from equations (2.3)–(2.8) (see the electronic supplementary material), and the case fatality is calculated from equation (2.9). The white circles in the top-left of each graph (a,b) show the approximate phenotypic position of current H5N1 viruses, low affinity for α2,6 receptors and a high level of viral replication. The white circles in the right of each graph (a,b) show the approximate phenotype position of seasonal human influenza viruses (i.e. subtypes H3N2 and H1N1); these viruses have a high affinity for α2,6 receptors and what we surmise to be an average level of viral replication. The white arrow in (a) shows the probable evolutionary path under the assumption that R0 is a good proxy for viral fitness. The white arrow in (b) shows the optimal evolutionary path from a public health perspective, i.e. the path that results in the most rapid virulence attenuation. R0,max = 1.82.
