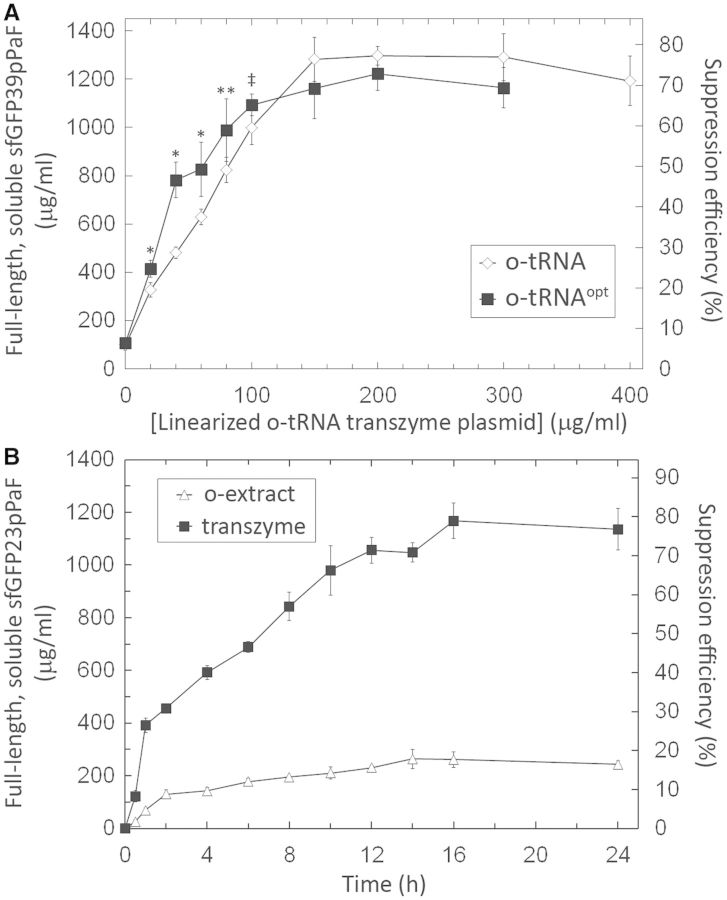
Figure 3.
(A) Titration of linearized o-tRNA and o-tRNAopt plasmid templates in the CFPS reactions containing pY71sfGFP39TAG. Error bars indicate ±1 standard deviation from six reactions. (*P < 0.01, **P = 0.025, ***P = 0.023) (B) Production of sfGFP containing pPaF at position 23 (sfGFP23pPaF) over 24 h. The ‘o-extract’ curve was generated from CFPS reactions in which the cell extract contained the o-tRNA. The ‘transzyme’ values were obtained from reactions, in which the o-tRNA and sfGFP23pPaF were produced simultaneously. A different set of reactions was incubated for each of the time points. Error bars indicate ±1 standard deviation for three reactions.

