
Figure 4.
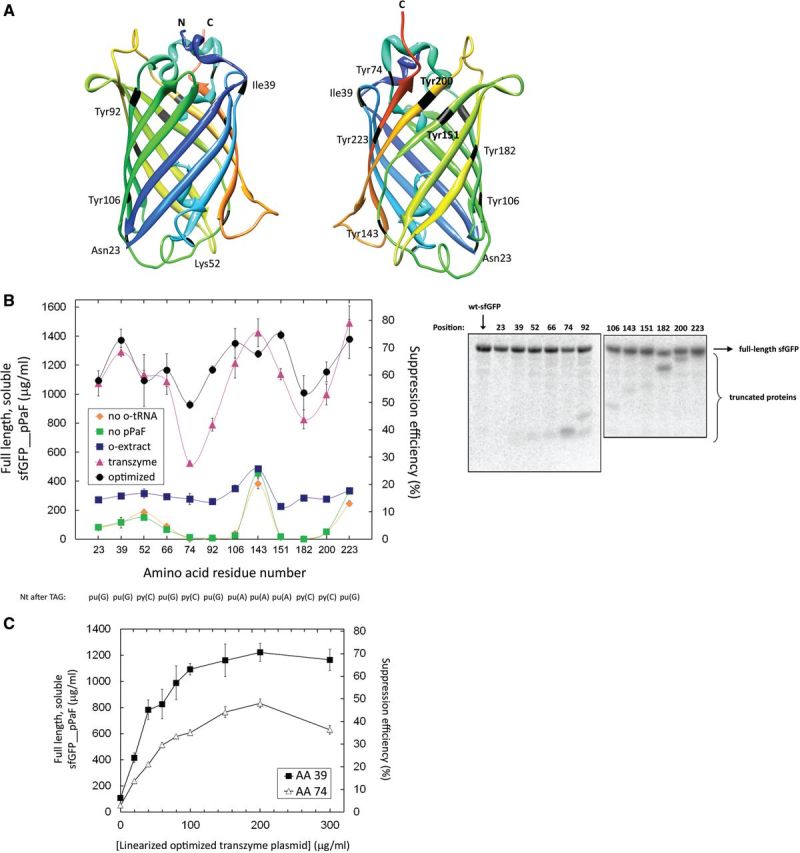
Codon context and nnAA incorporation. (A) sfGFP crystal structure; nnAA incorporation sites are labelled in black. The colour scheme shows the position along the primary sequence, with blue and green indicating the N-terminal regions, and orange and red depicting the C-terminal ones. The chromophore was not given in the crystal structure, hence the absence of Tyr66. (B) Full-length soluble modified protein yields as a function of the incorporation site under different cell-free conditions. ‘No o-tRNA’ and ‘no pPaF’ depict CFPS reactions in which the o-tRNA or the nnAA was omitted from the reaction solutions, respectively. The ‘o-extract’ series includes the reactions in which the orthogonal extract containing the constitutively expressed o-tRNA was used. The ‘transzyme’ and ‘optimized’ reactions contained 200 μg/ml of the linearized transzyme plasmid coding for o-tRNA and o-tRNAopt, respectively. Suppression efficiency is defined as the ratio of accumulated full-length soluble protein containing the nnAA over its natural counterpart (i.e. full-length soluble sfGFP without the nnAA). The bottom line indicates the nucleotides that lie immediately 3′ to the amber stop codon at indicated positions. Error bars depict ±1 standard deviation for three reactions. The right panel shows the SDS-PAGE autoradiogram of radiolabelled sfGFPs. The position of nnAA incorporation is indicated above each lane. (C) Titration of linearized o-tRNAopt plasmid templates in the CFPS reactions containing either pY71sfGFP39TAG or pY71sfGFP74TAG. Error bars indicate ±1 standard deviation for nine sfGFP39pPaF reactions, n = 3 for the sfGFP74pPaF reactions.