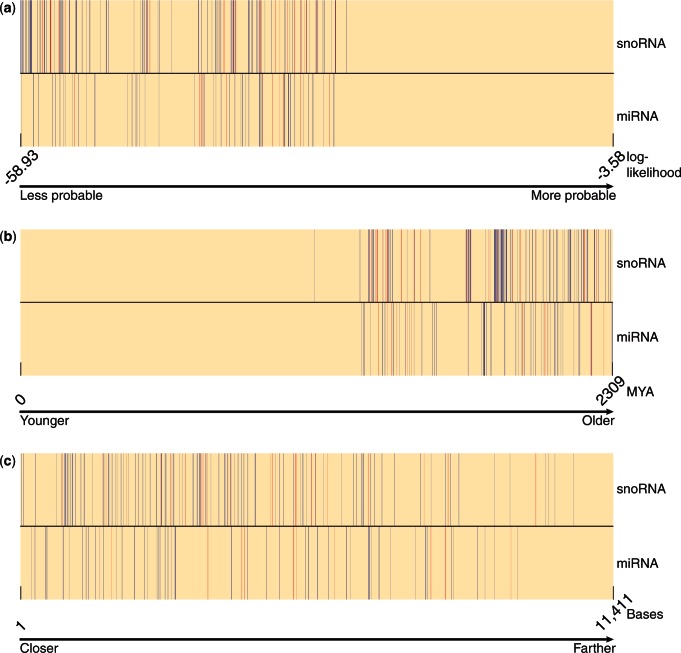
Figure 4.
Ranking of unique patterns. (Top rows) snoRNA-bearing (blue), snoRNA-mixed (red) and snoRNA-lacking (beige) unique patterns. (Bottom rows) miRNA-bearing (blue), miRNA-mixed (red) and miRNA-lacking (beige) unique patterns. The unique patterns are ranked according to (a) their log-likelihood; (b) the antiquity of the intron; and (c) their distance from CDS start.

