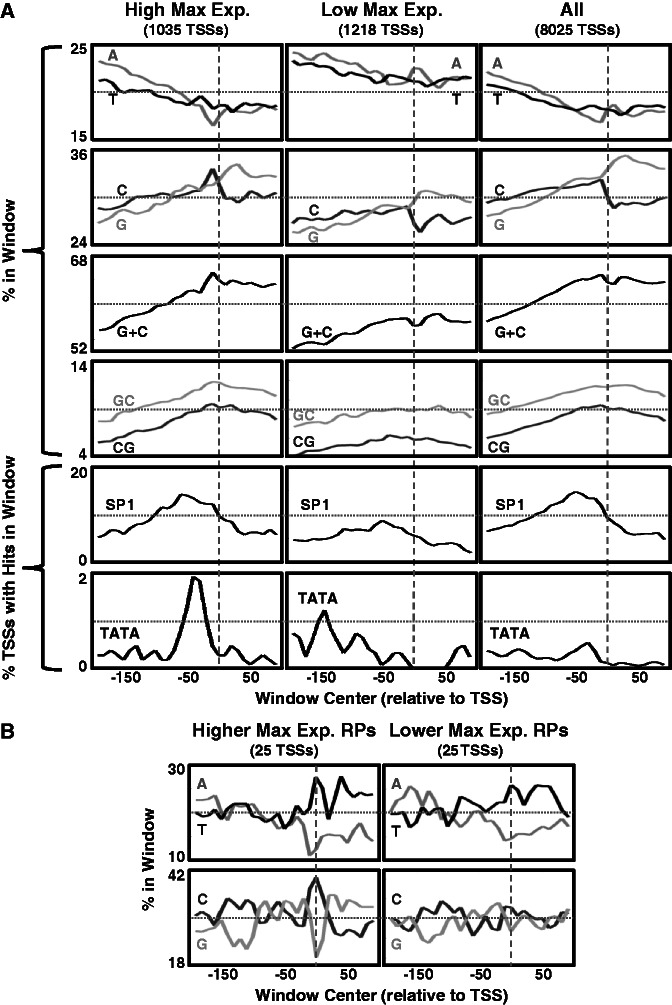
Figure 7.
Human core promoter sequence signals differ between constitutive TSSs with different maximal expression. (A) Mean nucleotide, k-mers and TATA box content, computed using a sliding window (20 bp long, 10 bp step) over the [−200, 100] region around TSSs that are constitutively expressesed in 10 different human cell lines (37). Plots are arranged in three columns: constitutive TSSs with high maximal expression in the left, constitutive TSSs with low maximal expression in the middle and all constitutive TSSs in the right. The vertical dashed lines represent the location of the TSS. The horizontal dotted lines are to assist with the comparison of plots between columns. SP1 - the GGGCGG\CCGCCC 6-mers of the SP1 TF binding motif consensus. (B) Fifty of the above constitutive TSSs were of RPs, and they were divided into two subsets of 25 higher expressed and 25 lower expressed (based on their maximal expression). Mean nucleotides content around the TSSs is shown for the two subsets.

