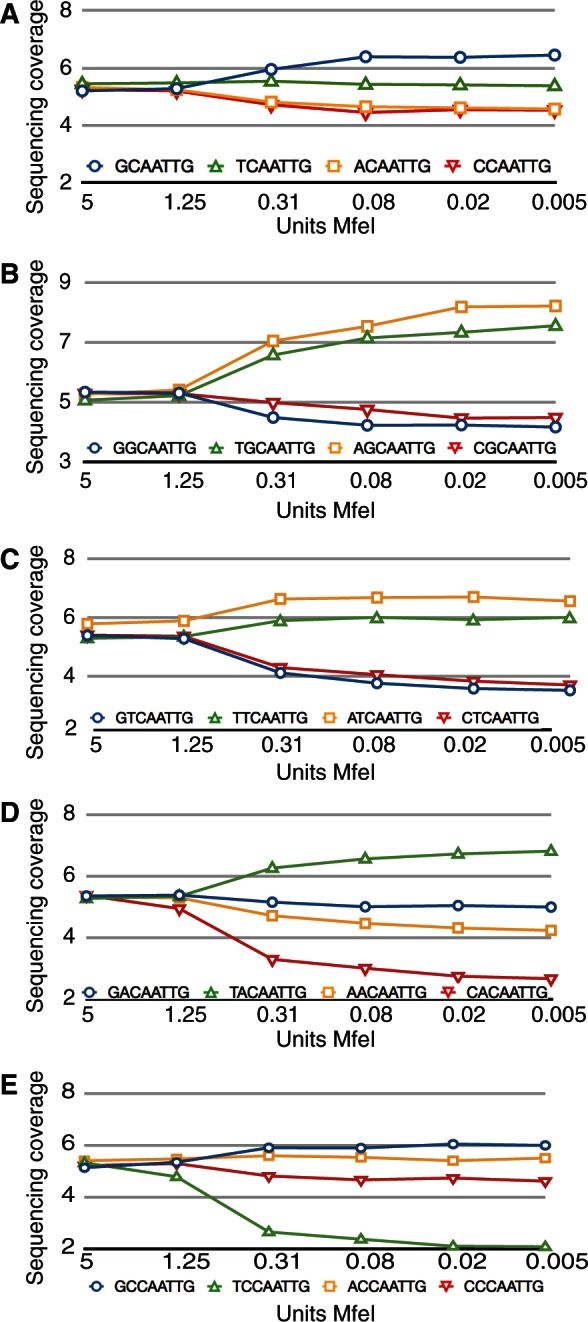
Figure 2.

MfeI activity is affected by flanking base preference. All graphs plot normalized sequencing coverage (y-axis) versus units of enzyme (x-axis). Blue circles, G base; green triangles, T base; yellow squares, A base; red triangles, C base. (A) Changes in sequencing coverage for the different bases adjacent to the MfeI half site, i.e. N-CAA. (B–E) Changes in sequencing coverage for the different distal bases of the dinucleotide adjacent to the MfeI half site, for the dinucleotide NG-CAA (graph B), NT-CAA (graph C), NA-CAA (graph D), NC-CAA (graph E).
