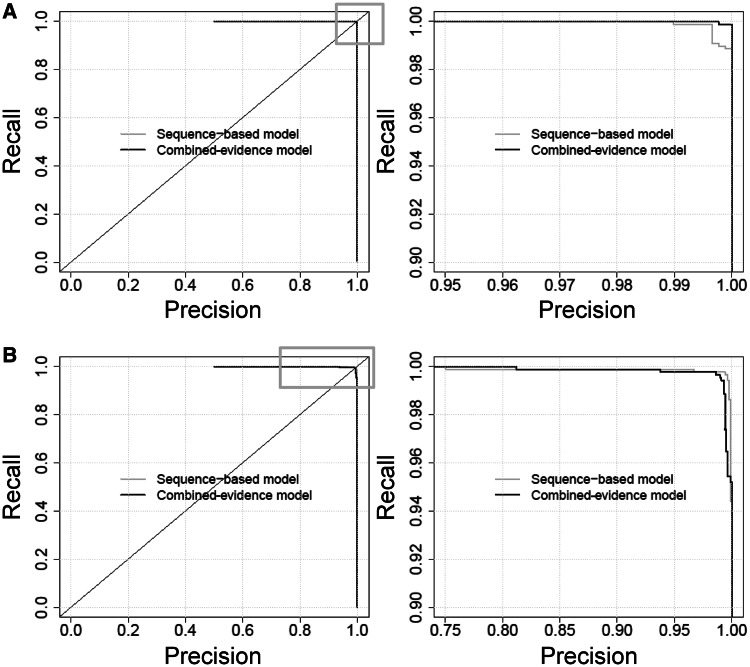
Figure 1.
Precision-recall curves for (A) the training data and (B) the test data, for the combined-evidence and sequence-only models. To distinguish the performance of the two methods, the varying areas of the full plots on the left side (highlighted with a gray box) are re-plotted at higher magnification (right side).

