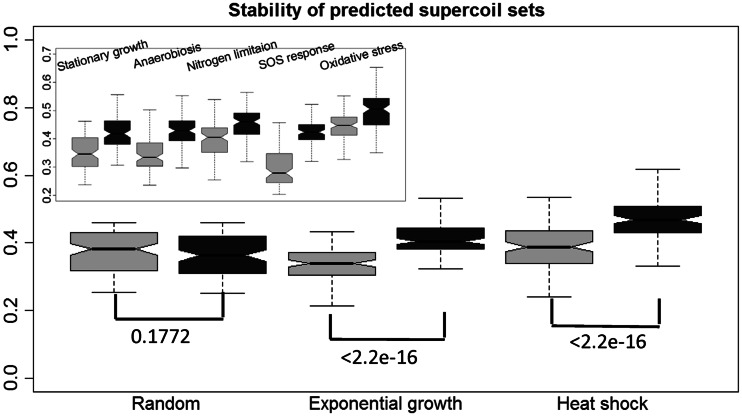
Figure 2.
Boxplots showing stabilities of the predicted folding domains (exponential growth and heat shock) based on the selected MGC set versus a randomly selected MGC set as defined in the main text. The comparison among the other five pairs of predicted domain sets is shown in the left upper corner. Each box with lighter gray level represents the distance distribution between the domains predicted using the selected MGCs and domains predicted using half of the selected MGCs, and each box with darker gray level is defined similarly but against domains predicted based on randomly selected MGCs, where the y-axis is the distance axis. The Wilcoxon test P-values for each pair of distributions are shown in the top of boxes of each corresponding set of predicted folding domains.

