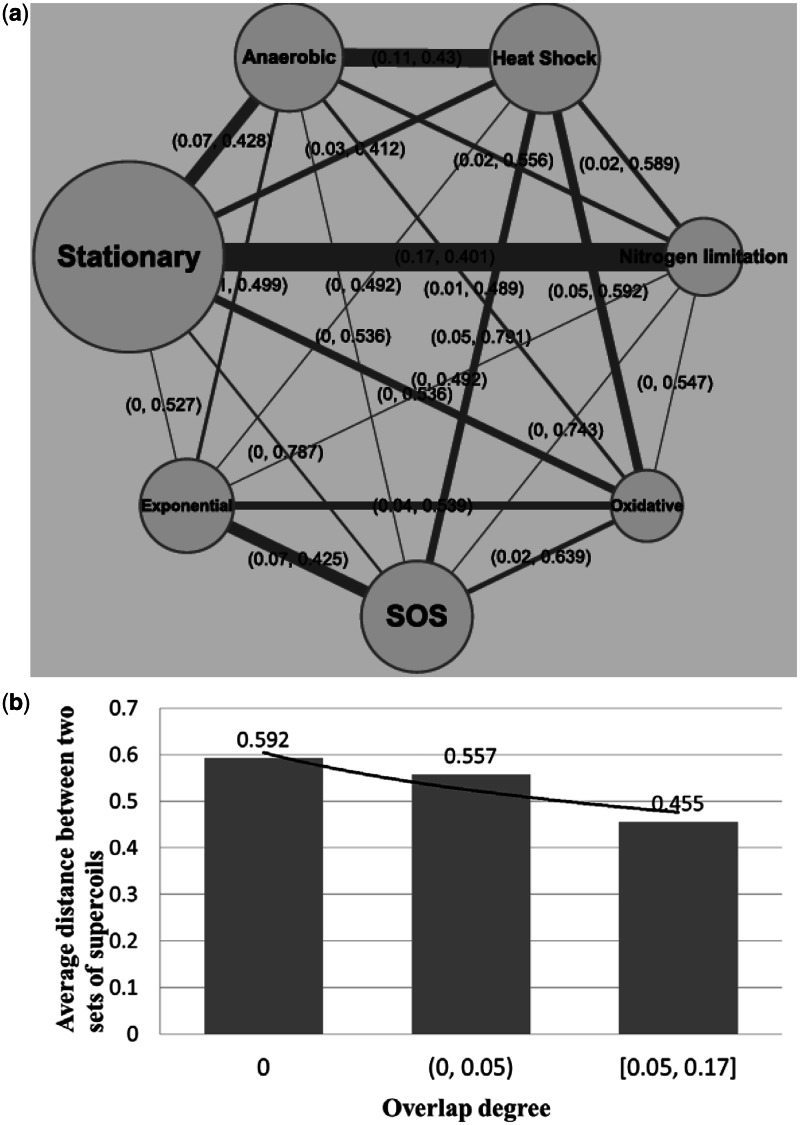
Figure 3.
(a) Degrees of overlap between each pair of MGC groups. The node size represents the size of a MGC group, and the edge width represents the number of overlapping MGCs between the two corresponding nodes. The label of each edge has two values: the first being the degree of overlap between the two corresponding MGC groups and the second being the distance between two predicted folding-domain sets, and (b) relationship between the degree of overlap among MGC groups and the distance between the corresponding folding-domain sets.

