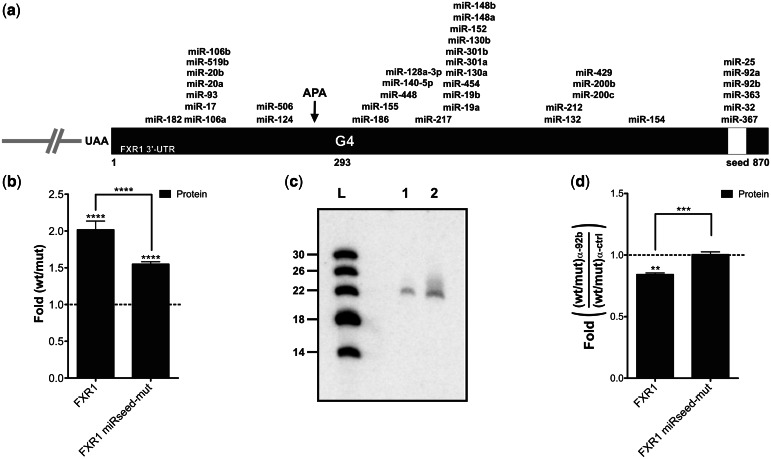
Figure 4.
FXR1 3′-UTR shortening and the microRNAs regulatory network. (a) Schematic representation of the FXR1 3′-UTR. The numbering refers to the position from the start site of the FXR1 3′-UTR. All predicted microRNA target sites with a mirSVR score <−0.5 according to the miRanda algorithm are shown (40). The white region corresponds to the predicted shared microRNA seed region that was mutated in the FXR1 miRseed-mut constructions. (b) Gene expression levels of different FXR1 constructs at the protein level as determined by luciferase assays. The x-axis identifies the constructions used and the y-axis the fold difference (wt result divided by G/A-mutated result) (for both FXR1 and miRseed-mut n = 4). (c) Northern blot hybridization for the detection of miR-92b performed using either 5 µg (lane 1) of small RNAs (<200 nt) or 50 µg of total RNA (lane 2) extracted from untransfected HEK293T cells. The numbers on the left refer to the sizes of a molecular RNA ladder of 5′-end labeled in vitro transcripts (lane L). (d) Gene expression levels of different FXR1 constructs at the protein level as determined by luciferase assays in the presence of either 100 nM miR-92b inhibitor or of irrelevant control inhibitors. The x-axis identifies the constructions used and the y-axis the fold difference (ratio wt on G/A-mutated version obtained in the presence of the miR-92b inhibitor divided by that obtained in presence of the control inhibitor) (both FXR1 and miRseed-mut n = 3). **P < 0.01, ***P < 0.001 and ****P < 0.0001.

