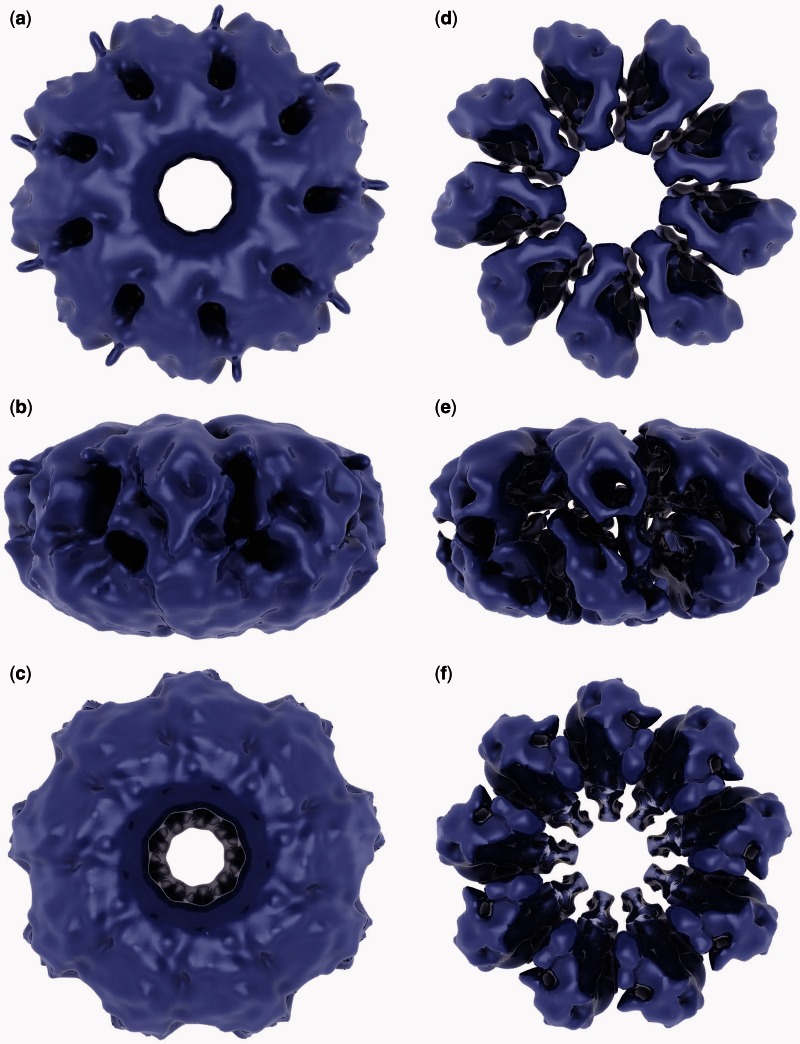
Figure 2.
Reconstructed map of the ICP8–ssDNA complex. (a–c) The density was rendered at a cut-off threshold used for fitting the crystal structure. C9 symmetry is clearly visible, which was imposed during the reconstruction based on the 9-fold symmetry apparent in the top and/or bottom views of raw particles that became better defined in the reference-free 2D class averages (Figure 1). (d–f) The volume was rendered at a higher threshold to show each symmetrical unit visible in the top and bottom views in d and f, respectively. In addition, at this threshold, two densities stacked on top of each other are visible in the side view shown in e.

