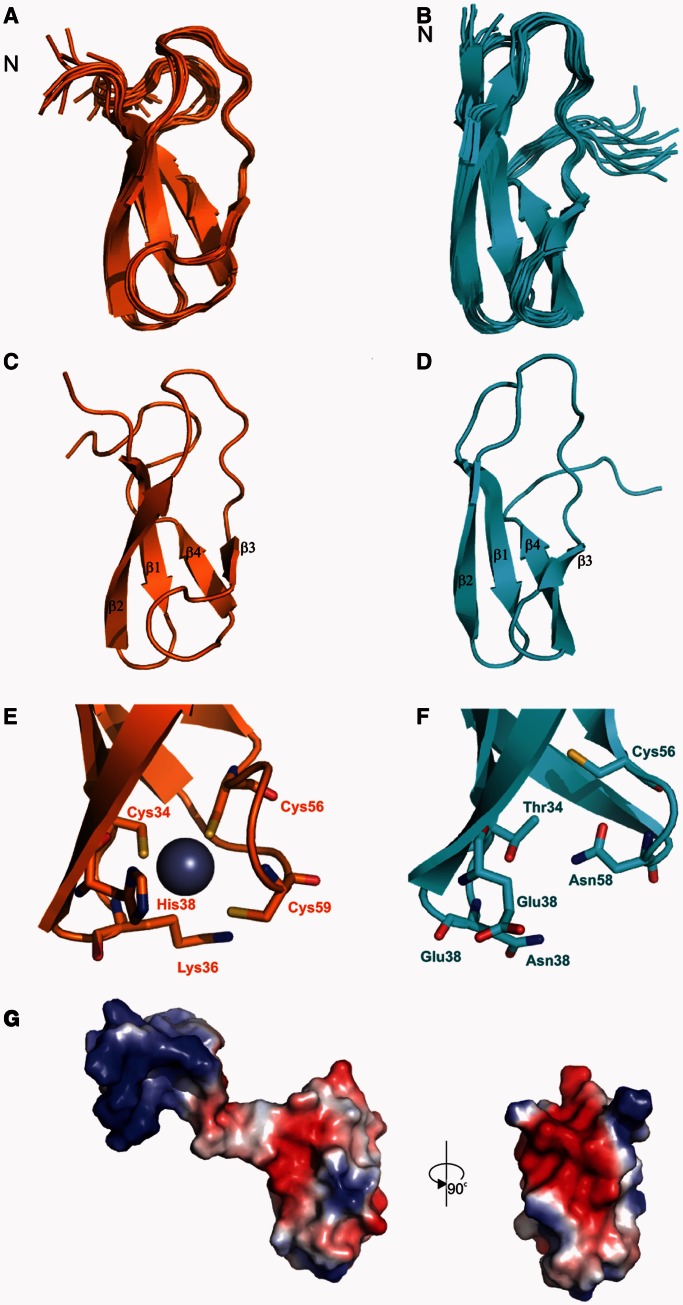
Figure 5.
Solution structures of RbpA from S. coelicolor (RbpASc) and M. tuberculosis (RbpAMt). NMR ensemble of the structure calculation for RbpASc (orange, A) and RbpAMt (cyan, B). Ribbon representation of the structure of RbpASc (C) and RbpAMt (D). Comparison of the Zn-binding site of RbpASc (E) with the equivalent residues in RbpAMt (F). Electrostatic surface potential for RbpASc (G) shown in two orientations. The flexible N-terminus in RbpASc is included in the orientation shown on the left and removed for clarity on the right.

