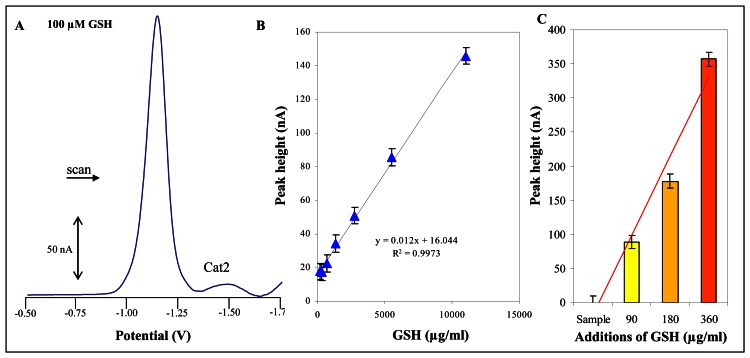
Figure 5.
Electrochemical determination of glutathione by using of automated electrochemical analyzer (sample injection was 10 ml). (A) Typical voltammogram of 100 μM GSH. (B) Dependence of height of Cat2 signal on GSH concentration. (C) Height of Cat2 signal measured after standard GSH additions (90, 180 and 360 μg/ml).

