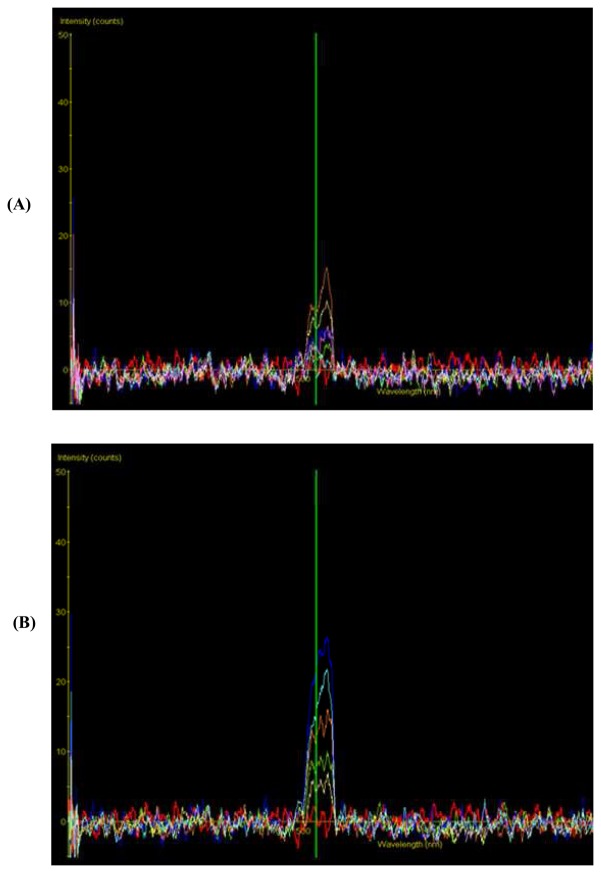
Figure 6.
Spectroscopic detection of EGFP emission from (A) wild-type and (B) E21 transformant at 0, 1, 2, 4 and 6 h time points following onset of desiccation stress. The Y-axis represents fluorescence intensity (arbitrary units) and the X-axis represents wavelength from 380 nm to 850 nm. The expected EGFP emission peak at the 509 nm position is indicated by the green vertical line (reproduced from Chong et al. 2007 [159]).

