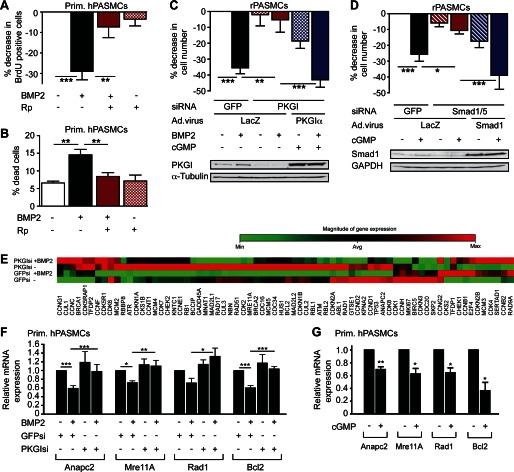
FIGURE 2.
Cooperation between cGMP and BMP to regulate PASMC growth and survival. A, human PASMCs were treated with BMP2 and/or Rp-pCPT-PET-cGMPS (Rp) for 48 h. BrdU incorporation was assessed by immunofluorescence labeling; the percent decrease of BrdU-positive cells compared with untreated cells is shown (n = 5, **, p < 0.01; ***, p < 0.001, Friedman test). Error bars, S.E. B, the percentage of trypan blue-positive, dead cells was determined after 48 h (n = 4, **, p < 0.01, one-way ANOVA). C, rat PASMCs were transfected with siRNAs targeting GFP or PKGI and infected with virus encoding LacZ or siRNA-resistant PKGIα. After receiving BMP2 and/or 8-pCPT-cGMP (cGMP) for the last 24 h, cells were counted at 72 h, relative to untreated cells with GFP siRNA/LacZ virus (n = 5, **, p < 0.01; ***, p < 0.001, one-way ANOVA); the immunoblot shows PKGI expression. D, cells were transfected with siRNAs targeting GFP or Smad1/5 and infected with LacZ or siRNA-resistant human Smad1 adenovirus; some cells received cGMP for the last 24 h. Cell numbers are expressed as in C (*, p < 0.05; ***, p < 0.001, one-way ANOVA); the immunoblot shows Smad1 expression. E, cell cycle control genes were analyzed in human PASMCs transfected with control or PKGI siRNA and cultured in the absence or presence of BMP2 for 24 h. β-actin, Gapdh, and β2-microglobulin served as controls in a quantitative RT-PCR-based array. F, expression of Anapc2, Mre11A, Rad1, and Bcl2 mRNA is shown, with levels in control siRNA-transfected, untreated cells assigned a value of 1 (n = 4–5, *, p < 0.05; **, p < 0.01; ***, p < 0.001, one-way ANOVA). G, human PASMCs treated with 8-pCTP-cGMP for 24 h were analyzed as in F (n = 3–4, *, p < 0.05; **, p < 0.01, two-tailed Student's t test).

