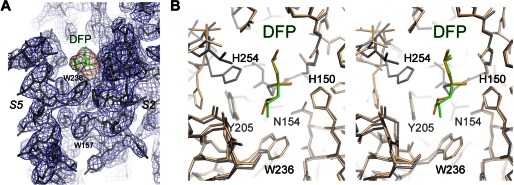
FIGURE 2.

GlpG-DFP cocrystal structure. A, the final 2Fo − Fc electron density map contoured at 1.2σ levels (blue). The omit difference map, calculated without the inhibitor, is contoured at 3.0σ levels (orange). B, comparison of the DFP complexes generated by cocrystallization (gray and green) and by soaking (wheat and orange; Protein Data Bank code 3TXT) (24). The most pronounced difference is at His-254. The superposition is shown as a stereo pair.
