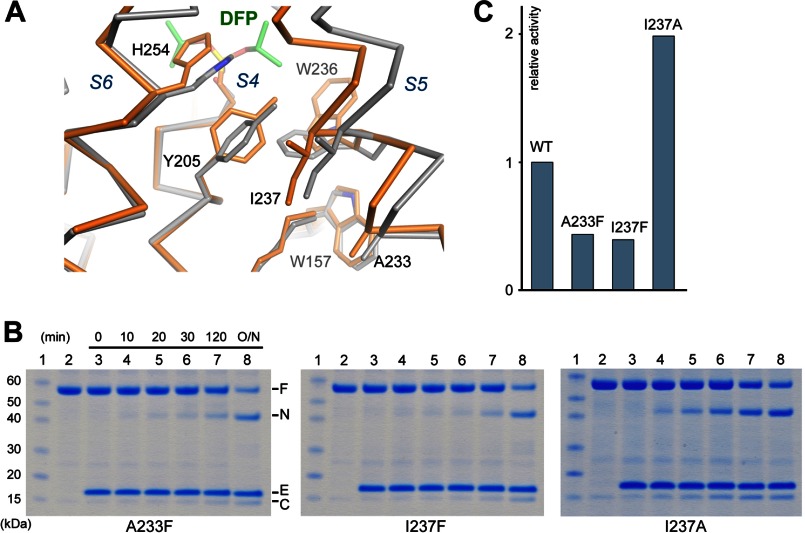
FIGURE 7.
Movement of the S5 helix in the inhibitor complex. A, the cocrystal structure (orange) is superimposed onto the apo structure (gray). The Cα traces and a subset of affected side chains are shown. The inhibitor carbons are shown in green. B and C, mutations at the S5-S4 interface affect the protease activity (assayed in detergent). F, full-length substrate; N, N-terminal cleavage fragment; C, C-terminal fragment; E, enzyme.

