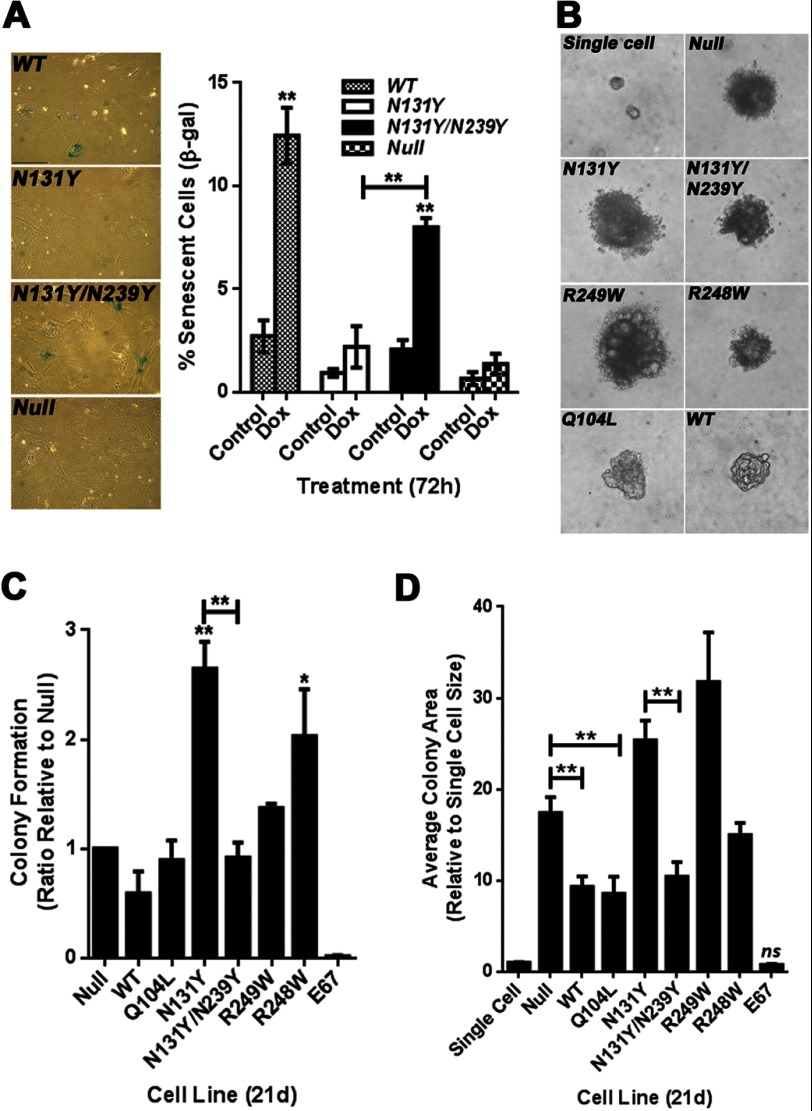
FIGURE 6.
Effect of the N239Y second-site mutation on the impact of N131Y on cell senescence and growth in soft agar. A, percentage of senescent cells before and after doxorubicin (Dox; 0.1 μm, 3 days) treatment was determined as a percentage of β-galactosidase-positive cells relative to total cell number per field. Representative images are shown to the left. B, representative images of colonies produced following 21-day (21d) growth in soft agar. Introduced mutations are indicated. C, colony forming ability of various p53 mutants and wild-type Hupki MEF cells (E67) was determined by expressing colonies per field relative to total cell number per field. Results are presented as a ratio of p53 null cell colony formation (null). D, average size of colonies from C was determined using NIH ImageJ software and expressed as a ratio of the average single cell area. All experiments were performed in triplicate and are compiled from three independent experiments. *, p < 0.05, **, p < 0.01.

