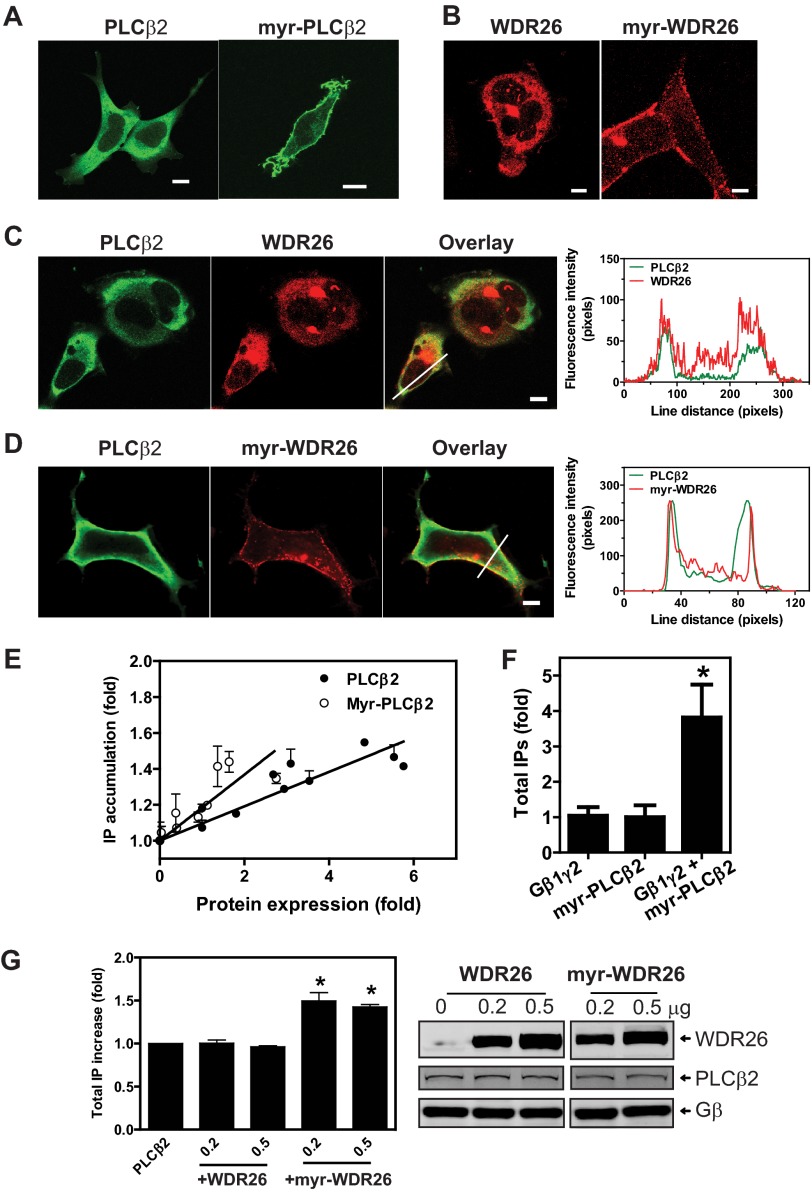
FIGURE 7.
Membrane translocation of PLCβ2 and WDR26 regulates PLCβ2 activity. A–D, cellular localization of PLCβ2 (A, C, and D), myr-PLCβ2 (A), FLAG-WDR26 (B and C), and myr-FLAG-WDR26 (B and D). HEK293 cells were transiently transfected with the indicated constructs and stained with a rabbit anti-PLCβ2 and/or mouse anti-FLAG. Representative images are shown. The graphs in the right panel of C and D show the distribution of fluorescence intensity of PLCβ2 and WDR26 along the lines drawn across the cells. Bar, 5 μm. E, total IPs in HEK293 cells transfected with increasing concentrations of PLCβ2 or myr-PLCβ2. The levels of protein expression were quantified by Western blotting and expressed as -fold increases over that in cells transfected with the smallest amount of plasmids. IP accumulation is expressed as -fold increases over that in cells expressing the lowest level of proteins (n = 3). F, total IP accumulation in HEK293 cells transfected with Gβ1γ2 (0.4 μg), myr-PLCβ2 (0.2 μg), or Gβ1γ2 (0.4 μg) plus myr-PLCβ2 (0.2 μg). Data are expressed as -fold increases of IPs over that generated by cells expressing myr-PLCβ2 alone. *, p < 0.05 indicates significance versus myr-PLCβ2 alone (n = 4). G, total IP accumulation in HEK293 cells transfected with PLCβ2 (0.1 μg) alone or PLCβ2 together with the indicated concentration (μg) of WDR26 or myr-WDR26. Data are expressed as -fold increases of IPs over that generated by cells expressing PLCβ2 alone. *, p < 0.05 indicates significance versus PLCβ2 alone (n = 3). Representative images in the right panel show the level of protein expression. Error bars represent S.E.

