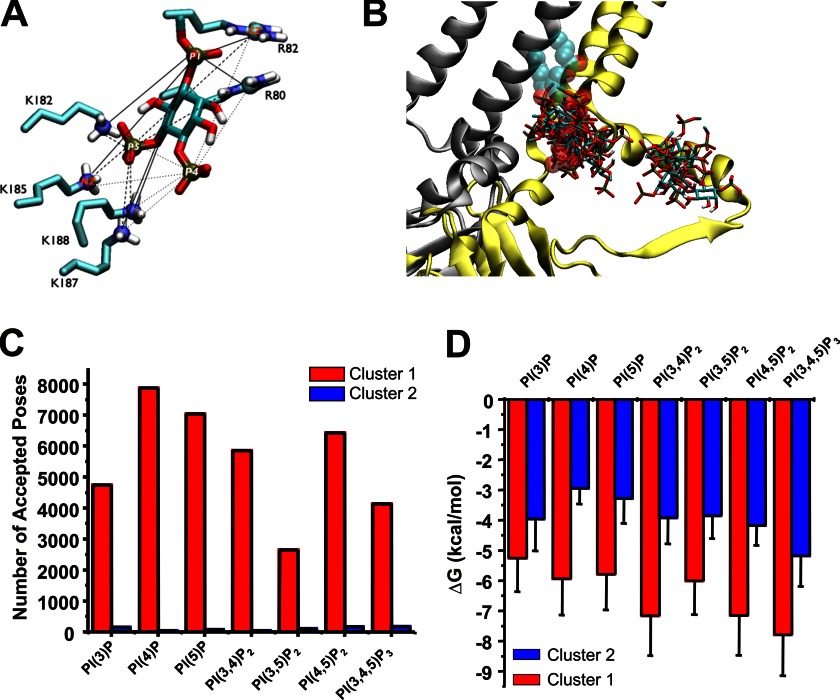
FIGURE 5.
A, distances between a ligand and the six putative binding residues. The pairs between the phosphorus atoms (P1, P4, and P5) of PI(4,5)P2 and the side chain atoms (CZ of Arg80, Arg82 and NZ of Lys182, Lys185, Lys187, and Lys188) are visualized by solid, dashed, and dotted lines. The distances of these pairs were used to cluster accepted poses. B, Kir 2.1–3SPI subunit A and D shown in yellow and silver ribbon, respectively, with the crystallographic PI(4,5)P2 bound to the subunit A shown in sphere translucently. An overlay of a single representative pose from each cluster of seven different C1-PIP ligands stacked on the Kir2.1–3SPI surface clearly indicates that these ligand bind primarily within two clusters. C, number of accepted poses within cluster 1 (red) and cluster 2 (blue) for each PIP. For each PIP, 96–99% of poses reside in cluster 1. D, average binding energy for poses in cluster 1 (red) and cluster 2 (blue) for each PIP docked to Kir2.1–3SPI.

