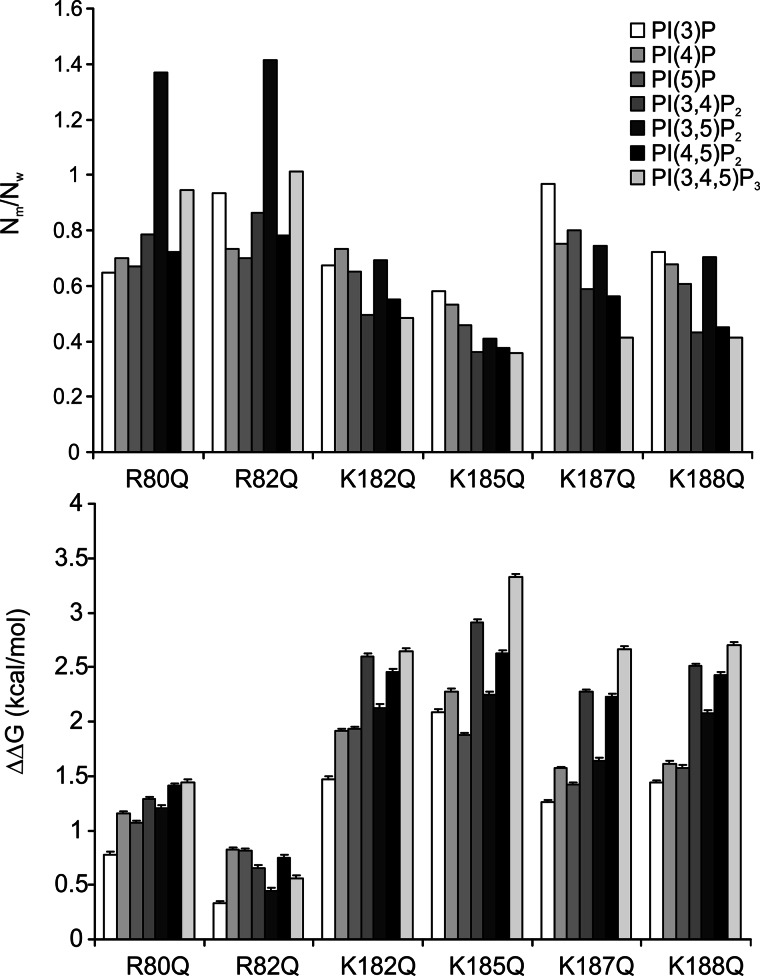
FIGURE 7.
Docking of various PIPs to Kir2.1 mutant protein models. The same docking simulations were carried out on the Kir2.1 model proteins with a single mutation as listed in this figure. Top, the number of accepted poses in cluster 1 relative to that of wild type protein is shown. Bottom, the difference of binding free energy in the cluster 1 between the wild type and each mutant protein is shown in kcal/mol unit. Error bars represent S.E.

