Background: The Pr and Pfr parent states of prototypical and bathy bacteriophytochromes exhibit different thermal stabilities.
Results: Unlike bathy phytochromes, the biliverdin cofactor of prototypical phytochromes displays distinct conformational heterogeneity in Pfr.
Conclusion: This heterogeneity enables thermal Pfr to Pr conversion in prototypical phytochromes.
Significance: Understanding thermal deactivation of the signaling Pfr state is essential for elucidating the molecular function of phytochromes.
Keywords: Computer Modeling, Infrared Spectroscopy, Photoreceptors, Raman Spectroscopy, Spectroscopy, QM/MM Calculations, Phytochrome, Resonance Raman
Abstract
Phytochromes act as photoswitches between the red- and far-red absorbing parent states of phytochromes (Pr and Pfr). Plant phytochromes display an additional thermal conversion route from the physiologically active Pfr to Pr. The same reaction pattern is found in prototypical biliverdin-binding bacteriophytochromes in contrast to the reverse thermal transformation in bathy bacteriophytochromes. However, the molecular origin of the different thermal stabilities of the Pfr states in prototypical and bathy bacteriophytochromes is not known. We analyzed the structures of the chromophore binding pockets in the Pfr states of various bathy and prototypical biliverdin-binding phytochromes using a combined spectroscopic-theoretical approach. For the Pfr state of the bathy phytochrome from Pseudomonas aeruginosa, the very good agreement between calculated and experimental Raman spectra of the biliverdin cofactor is in line with important conclusions of previous crystallographic analyses, particularly the ZZEssa configuration of the chromophore and its mode of covalent attachment to the protein. The highly homogeneous chromophore conformation seems to be a unique property of the Pfr states of bathy phytochromes. This is in sharp contrast to the Pfr states of prototypical phytochromes that display conformational equilibria between two sub-states exhibiting small structural differences at the terminal methine bridges A-B and C-D. These differences may mainly root in the interactions of the cofactor with the highly conserved Asp-194 that occur via its carboxylate function in bathy phytochromes. The weaker interactions via the carbonyl function in prototypical phytochromes may lead to a higher structural flexibility of the chromophore pocket opening a reaction channel for the thermal (ZZE → ZZZ) Pfr to Pr back-conversion.
Introduction
Phytochromes utilize light as a source of information for initiating a biochemical reaction cascade (1, 2). These photoreceptors, initially discovered in higher plants but also found in microorganisms (3–5) and fungi (6, 7), include a light sensor module and catalytic unit, a serine/threonine kinase (in plant phytochromes) (8), and a histidine kinase in most of the bacterial orthologs (9–11). Phytochromes covalently bind a linear tetrapyrrole chromophore that upon light absorption undergoes a double bond isomerization at the methine bridge between the pyrrole rings C and D (Fig. 1). This photochemical event is followed by a series of thermal relaxation processes of the cofactor and the protein eventually causing a major protein structural change that activates the kinase (9). Also, the de-activation is linked to a photoinduced reaction sequence that transforms the sensor module back to the initial state. In this sense, canonical phytochromes represent a photoswitch between the red-absorbing (Pr)3 and far-red absorbing (Pfr) parent states.
FIGURE 1.
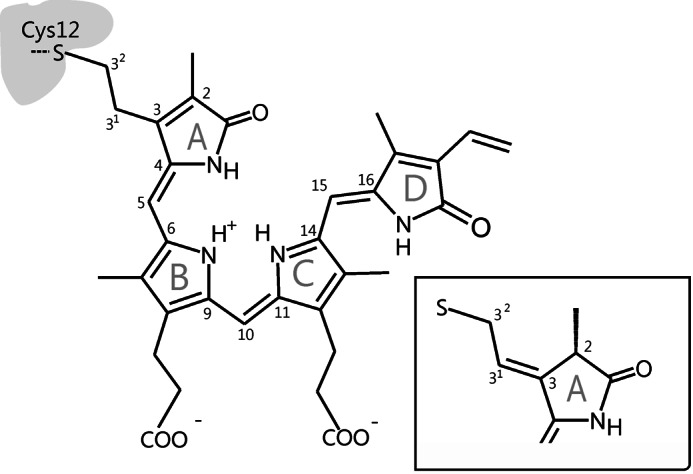
Structure and atom numbering of the biliverdin chromophore in PaBphP in the 32-linked attachment to the protein. Inset, chromophore structure at ring A in case for 2(R),3(E)-PΦB type binding (π-electron rearrangement).
Because recombinant bacterial phytochromes are easily accessible, which in turn facilitates structural and spectroscopic studies, they are widely used as model systems for phytochromes from plants. A survey of phytochrome-encoding genes revealed, however, that canonical phytochromes, carrying phycocyanobilin as chromophore, are present mainly in cyanobacteria, whereas other prokaryotic organisms carry biliverdin (BV) as the chromophore (Fig. 1). While being attached to the protein through a different binding site, BV adopts nearly the same conformation in the binding pocket and undergoes an identical photochemistry with a C-15=C-16 double bond photoisomerization (12–15). These BV-harboring bacteriochromes can further be grouped into prototypical and bathy phytochromes in which the thermodynamically stable states are Pr and Pfr, respectively (16, 17).
This different stability of the parent states is most probably the reason why three-dimensional structures so far have been mainly obtained for the Pr state of protypical phytochromes and the Pfr state of bathy phytochromes (13–20). Although the gross chromophore structures in the respective parent states are likely to be similar in prototypical and bathy phytochromes, it appears to be premature to consider the available three-dimensional structures of the Pr states of the prototypical phytochrome and the yet only available three-dimensional structure of the Pfr state of bathy phytochrome from Pseudomonas aeruginosa (PaBphP) as representative structures for the respective parent states in both classes of phytochromes (12). First, the sequence homology between bathy and prototypical phytochromes is rather poor. In the case of phytochrome Agp1 (UniProtKB accession number Q7CY45) and Agp2 (UniProtKB accession number Q8UDG1) from Agrobacterium tumefaciens, a sequence identity of only 35% and positive matches of 53% were predicted using the sequence BLAST protein alignment tool (21, 22). Thus, the functionally important structural changes of the protein that activate or deactivate the associated catalytic module can hardly be assessed from a comparative structural analysis of the Pr and Pfr states of prototypical and bathy phytochromes. Second, the three-dimensional models suggest significant differences between prototypical and bathy phytochromes that are independent of the specific state of the photosensor, i.e. the mode of chromophore attachment to the protein (14, 15, 18). However, these differences per se do not reveal the molecular origin for the different thermodynamic stability and reaction channels of the parent states in prototypical and bathy phytochromes. Such an understanding is in turn essential for elucidating the strategy of how nature utilizes either red or far-red light to trigger physiological processes.
In this work, we have addressed this issue focusing on the comparative analysis of the Pfr states of bathy and prototypical phytochromes. Starting with the crystallographic structure of the Pfr state of the bathy phytochrome from PaBphP (14), molecular dynamics (MD) simulations combined with calculations using molecular mechanical-quantum mechanical (QM/MM) hybrid methods were carried out to achieve a structural refinement for the chromophore binding pocket, guided by a comparison of the calculated and the experimental resonance Raman (RR) spectra of the tetrapyrrole cofactor (23). Specifically, we asked whether the results of the present approach were consistent with the original assignment of the bilin structure to a ZZEssa configuration (14), a plausible assignment albeit not unambiguously backed by the rather disperse electron density data, which in principle would also be compatible with a ZZZssa geometry from protein crystallography (14). Similarly, we checked the proposed chromophore binding via thiol addition to the exocyclic vinyl group of ring A. This tetrapyrrole-protein linkage is in contrast to prototypical bacteriophytochromes in which BV attachment is accompanied by the formation of an exocyclic double bond and the saturation of ring A (18, 24). The combined theoretical-experimental analysis of the Pfr state of PaBphP allows for a “calibration” of the RR spectroscopic method that was then employed to investigate the chromophore structures in the Pfr states of various prototypical BV-binding phytochromes for which no three-dimensional structural data were available. It was demonstrated that, unlike to the highly homogeneous chromophore conformation in bathy phytochromes, the bilin cofactors in the Pfr states of prototypical phytochromes displayed a substantial structural heterogeneity that primarily referred to the methine bridges between rings A and B (A-B) and C and D (C-D) (25). The molecular origin of this heterogeneity and the implications for the lower thermodynamic stability of the Pfr state are discussed.
MATERIALS AND METHODS
Sample Preparation
Expression of the proteins, purification, and the assembly of the holoproteins was described previously (22, 26–28). In addition to the wild-type (WT) A. tumefaciens phytochrome 1 (Agp1), two further engineered variants from the same phytochrome were investigated as follows: the C20A site-directed mutant (Agp1C20A) and a truncated variant lacking the first 18 N-terminal amino acids (Agp1Δ18) (29). In both mutants, the chromophore is bound in a noncovalent manner to the protein. Cyanobacterial phytochrome CphB (Calothrix PCC7601) was expressed and purified as described previously (30). In all cases, protein variants lacking the histidine kinase module were used. Previous comparative studies of Agp1 revealed identical RR spectra for proteins including and lacking the kinase module (31, 32).
Buffer solutions used for the RR experiments included 50 mm Tris/HCl, 300 mm NaCl, 5 mm EDTA in H2O (D2O) at a pH (pD) of 7.8. Protein samples were concentrated via Microcon filters up to a value corresponding to an optical density of ∼50 at 280 nm.
Synthesis of Isotopically Labeled Biliverdin
Unlabeled BV was synthesized from bilirubin by reaction with 2,3-dichloro-5,6-dicyanobenzoquinone in dimethyl sulfoxide (97%). Obtained BV was esterified by reaction with sulfuric acid in methanol (17 h, −5 °C, 67%). BV-dimethyl ester was then cleaved at the central C-10 position according to Ref. 33. This reaction yields four products, each half of BV (“right” and “left”), and their respective thiobarbituric acid adducts; these adducts contain the carbon atom, originally located at position 10. Both the right and the left halves were isolated from this reaction mixture. The left half, representing the former A-B ring part of BV, was formylated with o-trimethyl [13C]formate (ambient temperature, 5 min, 65%). Then the formylated left half was condensed with the right half (ethyl acetate, 0 °C, POCl3, 15 min, addition of methanol, further stirring for 30 min, 32%, 13C NMR: 10-13C, 115.0 ppm). [13C]BV-dimethyl ester was saponified following the procedure described by Lindner et al. (34): H2O, CF3COOH, 1:1, Dowex ion exchange resin, 44 h, ambient temperature; 77%, 13C NMR: 10-13C, 115.9 ppm.
Resonance Raman Spectroscopy
RR measurements were performed using a Bruker Fourier transform Raman spectrometer RFS 100/S with 1064 nm excitation (Nd-YAG cw laser, line width 1 cm−1), equipped with a nitrogen-cooled cryostat from Resultec (Linkam) (32, 35). All spectra were recorded at −140 °C unless noted otherwise. The laser power at the sample was kept at 780 milliwatts. To identify potential laser-induced damage of the phytochrome samples, RR spectra before and after a series of measurements were compared. In no case were changes between these control spectra determined. For each spectrum, the accumulation time was 1 h. Protein and buffer Raman bands were subtracted on the basis of a Raman spectrum of apophytochrome. Photoconversion from Pfr to Pr (Pr to Pfr) state was achieved by a 10-s (2 min) sample illumination at 20 °C with 785 nm light (660 nm) using a light-emitting diode, corresponding to a photon fluence of ∼2·1022 (4·1022) photons/m2. The raw spectra of the Pfr and Pr obtained in this way included minor contributions from the Pr and Pfr state, respectively. These contributions were removed by mutual subtraction of the experimental spectra from each other, using the characteristic marker bands of Pr and Pfr as a reference. The pure spectra were further analyzed by a band fitting procedure assuming Lorentzian band shapes.
IR Spectroscopy
For IR spectroscopic measurements, the protein samples were dissolved in 50 mm Tris, 300 mm NaCl, 5 mm EDTA in H2O (D2O) at pH (pD) 7.8 and concentrated via Microcon filters. The concentration of the samples was between 50 and 150 mg ml−1 as determined by the intensity of the UV-visible absorbance at 280 nm. The protein was placed between two BaF2 windows (15 mm diameter) with a 3-μm thick polytetrafluoroethylene spacer and equilibrated at 20 °C. IR spectra were recorded in a Bruker IFS66v/s spectrometer equipped with a liquid nitrogen cooled HgCdTe detector (J15D series, EG&G Judson). Spectra were recorded 2 min prior to illumination and 30 s after the illumination, and subsequently the difference spectra were calculated by subtracting the initial state spectra from the illuminated state spectra. Illumination of the sample was performed as in the Raman experiments (see above).
Molecular Dynamics Simulations
The initial set of coordinates for the MD simulations were extracted from the crystallographic structure of the photosensory domain of PaBphP in the Pfr state (Protein Data Bank code 3C2W) (14). The secondary structure of residues 376–485 in the peptide chain, which are missing in the original Protein Data Bank submission, were predicted by PSIPRED (36, 37) as an unordered loop. Accordingly, their three-dimensional coordinates were generated using CHARMM (32b2) software (38), followed by energy minimization and a short 5-ns MD simulation for structural equilibration. Assignment of protons to titratable groups was done on the basis of visual inspection of the local environment of the charged amino acids and histidine residues. In particular, His-247 and His-277 in the chromophore binding pocket were protonated at their Nϵ positions. The protein was then solvated in a hexagonal box of 58687 TIP3P water molecules and charge-neutralized with NaCl. After a series of energy minimization and equilibration steps, restraint-free simulations were performed under periodic boundary conditions for 6 ns in the isothermal-isobaric (NTP) ensemble at 300 K. For this, a combination of the Langevin-Piston Nose-Hoover (39, 40) method was used with reduced Langevin damping factors (from 5.0 to 1.0). All MD simulations were performed keeping the BV cofactor molecule fixed due to missing force field parameters.
The MD simulations were performed using the NAMD (version 2.6) software (41) in combination with the CHARMM all-atom force field (42). For the treatment of nonbonded interactions in the system, the particle-mesh-Ewald method (43) was employed for electrostatics, whereas a cutoff of 12 Å in combination with a switching function was used for van der Waals interactions.
Quantum Mechanical/Molecular Mechanical Calculations
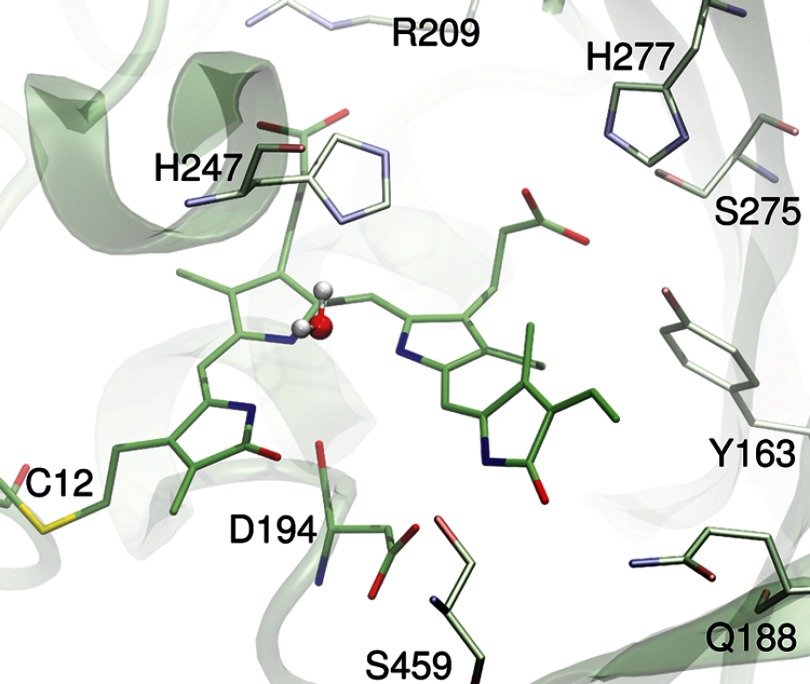
50 snapshots were extracted from the last 100 ps of the MD simulation, in intervals of 2 ps. For each snapshot, the geometry of the chromophore-binding site, including the chromophore and all residues within a radius of 15 Å from the C-10 atom of the BV cofactor (active region), was optimized using a hybrid QM/MM approach (44) combining the B3LYP density functional (45) with the CHARMM27 force field (42) implemented in the modular program package Chemshell (46). The 6–31g* basis set was used to describe the QM region. Two different QM/MM partition schemes were considered. The first one was defined with a relatively small QM region of only of 81 atoms, including the BV cofactor and the Cys-12 side chain, whereas the second partition scheme with 96 atoms was constructed by extending the QM region to include Asp-194 and the water molecule located in the tetrapyrrole cavity (pyrrole water) (Fig. 2). These two partitions will be referred to as the QM81/MM and QM96/MM models, respectively. The lowest QM/MM energy of the QM96/MM model was computed for the snapshot extracted after 5920 ps of the MD simulation. This optimized structure is denoted as QM/MMmin. Furthermore, the covalent bond cuts at the QM/MM borders on the Cys-12 side chain in the QM81/MM model, and also on the Asp-194 backbone in the QM96/MM model, were saturated with hydrogen link atoms.
FIGURE 2.
Optimized structure of the chromophore binding pocket of the Pfr state of PaBphP according to the QM/MM model of lowest energy (QM/MMmin model).
The average Raman spectrum of the protein-bound BV chromophore was calculated by summing up the Raman spectra computed at a QM/MM level for each of the snapshots following published protocols (23, 47–49). It has been demonstrated for other phytochromes that calculated (off-resonance) Raman intensities are a good approximation for Raman spectra measured under rigorous resonance and pre-resonance excitation (50, 51).
Homology Model for the Bathy Phytochrome from A. tumefaciens
Homology modeling of the photosensory module of A. tumefaciens phytochrome 2 (Agp2) (6–499 amino acids) was performed by using SWISS-MODEL (52) with the crystal structure of the Agp2 homolog (53) from PaBphP P. aeruginosa (14) as a template with a sequence identity of 36.3%. In a subsequent step, energy minimization and structural idealization were performed by the program REFMAC5 (54). Structure validation was performed with the programs PROCHECK (55) and WHAT_CHECK (56). To obtain an appropriate comparative model of the chromophore binding pocket from the Agp2 photosensory module, in a final step the model of Agp2 was separately superimposed with the crystal structure of the PaBphP (Protein Data Bank code entry 3C2W, see Ref. 14), and the amino acids around the chromophore were manually rebuilt with the program COOT (57). All structure superpositions of the backbone α-carbon traces were performed using the CCP4 program LSQKAB (54).
RESULTS AND DISCUSSION
Structure of the Biliverdin Binding Pocket in PaBphP
During the MD simulation, the protein approaches a stable structure after a few nanoseconds as shown by the root-mean-square deviations (r.m.s.d.) of the carbon backbone atoms with respect to the crystal structure (Fig. 3). The relatively large r.m.s.d. values of ∼2.7 Å primarily result from conformational changes at loop and coil regions. Additional changes of the protein secondary structure were not observed, but we noted a slightly increased radius of gyration (28.9 Å) compared with the crystal structure (27.9 Å).
FIGURE 3.
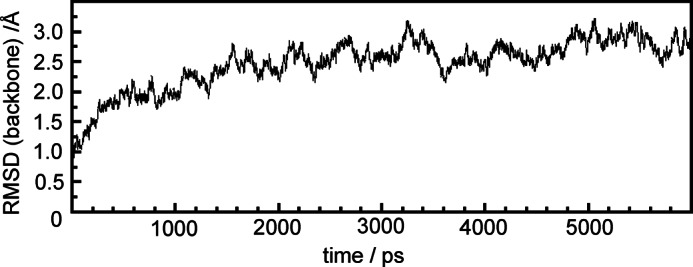
Evolution of the r.m.s.d. for the Cα atoms of PaBphP during the 6-ns MD simulation.
For all snapshots, converged BV structures under preservation of the initial configuration/conformation of the methine bridges were obtained (Fig. 2). The structural differences between the QM96/MM and QM81/MM model were very small and did not exceed 0.003 Å for bond lengths and 2° for bond and dihedrals angles. Only the distances between the ring D and B NH groups and Asp-194 are increased when this residue is included in the QM region (QM96/MM; Table 1). The QM description of the BV cofactor afforded the expected bond length alternation pattern for the methine bridges with the C-4=C-5 and C-15=C-16 double bonds (1.37 Å) and the C-5–C-6 and C-14–C-15 single bonds (1.43 Å), whereas the electronic conjugation was fully pronounced at the central B-C methine bridge, as reflected by the nearly equal C–C bond lengths of ∼1.40 Å. Calculated bond angles for the three methine bridges were higher by ∼10° with respect to the crystallographic values, although quite similar torsional angles were predicted. Structural differences of the BV cofactor optimized for the various snapshot models were very small with standard deviations of less than 0.003 Å, 1 and 2° for the bond lengths, bond angles, and dihedral angles of the methine bridges, respectively. In particular, variations of the dihedral angles at the A-B and C-D methine bridge were half the value predicted previously for phycocyanobilin in plant phytochrome phyA (48) and phycoviolobilin in phycoerythrocyanin (49), pointing to a more tightly packed chromophore binding pocket in the Pfr state of PaBphP.
TABLE 1.
Selected structural parameters of the PaBph-BV chromophore and its vicinity
Bond lengths are given in Å and angles in degrees. Coordinates are defined according to Fig. 1. The abbreviations used are as follows: avg., average; max., maximum; min., minimum.
| X-ray | QM96/MM snapshots |
QM81/MM snapshots |
||||||
|---|---|---|---|---|---|---|---|---|
| QM/MMmin | Avg. | Max. | Min. | S.D. | Avg. | S.D. | ||
| A-B methine bridge | ||||||||
| C(4)–C(5) | 1.528 | 1.371 | 1.371 | 1.374 | 1.367 | 0.002 | 1.370 | 0.002 |
| C(5)–C(6) | 1.536 | 1.432 | 1.433 | 1.439 | 1.427 | 0.003 | 1.433 | 0.001 |
| C(4)–C(5)–C(6) | 116.4 | 127.3 | 127.2 | 128.7 | 125.4 | 0.7 | 127.5 | 0.75 |
| N(A)–C(4)–C(5)–C(6) | 17.0 | 8.0 | 8.5 | 11.4 | 6.0 | 1.3 | 8.0 | 1.1 |
| C(4)–C(5)–C(6)–N(B) | 5.7 | 14.5 | 16.5 | 20.6 | 9.4 | 1.8 | 15.5 | 1.7 |
| B-C methine bridge | ||||||||
| C(9)–C(10) | 1.398 | 1.400 | 1.400 | 1.407 | 1.392 | 0.003 | 1.400 | 0.003 |
| C(10)–C(11) | 1.393 | 1.398 | 1.396 | 1.400 | 1.387 | 0.003 | 1.393 | 0.003 |
| C(9)–C(10)–C(11) | 118.31 | 130.9 | 129.9 | 131.5 | 128.6 | 0.7 | 128.8 | 0.55 |
| N(B)–C(9)–C(10)–C(11) | −0.6 | −6.7 | −6.1 | −3.6 | −8.8 | 1.1 | −6.9 | 1.23 |
| C(9)–C(10)–C(11)–N(C) | −8.2 | −5.3 | −4.9 | −2.9 | −7.0 | 0.8 | −5.3 | 0.71 |
| C-D methine bridge | ||||||||
| C(14)–C(15) | 1.535 | 1.434 | 1.434 | 1.439 | 1.427 | 0.002 | 1.430 | 0.003 |
| C(15)–C(16) | 1.535 | 1.372 | 1.369 | 1.373 | 1.365 | 0.002 | 1.371 | 0.002 |
| C(14)–C(15)–C(16) | 119.1 | 128.6 | 127.3 | 128.9 | 125.4 | 0.9 | 126.9 | 0.89 |
| N(C)–C(14)–C(15)–C(16) | −150.3 | −155.4 | −152.7 | −148.2 | −158.8 | 2.2 | −155.6 | 1.55 |
| C(14)–C(15)–C(16)–N(D) | −150.7 | −160.0 | −159.8 | −155.4 | −163.2 | 1.6 | −157.9 | 1.53 |
| BV- H2O | ||||||||
| N(A)···OH2 | 2.952 | 2.899 | 3.074 | 2.813 | 0.061 | 2.806 | 0.020 | |
| N(C)···OH2 | 2.900 | 2.863 | 3.056 | 2.807 | 0.042 | 2.799 | 0.022 | |
| BV-protein matrix | ||||||||
| N(B)–O(Asp-194) | 3.054 | 2.858 | 2.940 | 3.155 | 2.819 | 0.074 | 2.911 | 0.17 |
| N(D)–OD(Asp-194) | 3.00 | 2.831 | 2.873 | 3.077 | 2.774 | 0.068 | 2.635 | 0.03 |
| O(D)···OG(Ser-459) | 4.13 | 3.395 | 3.40 | 3.597 | 3.212 | 0.116 | 3.382 | 0.125 |
| O(D)···NE(Gln-188) | 3.40 | 3.329 | 3.253 | 3.776 | 2.860 | 0.301 | 3.372 | 0.318 |
| O1(ppsC)···OH(Tyr-163) | 2.91 | 2.666 | 2.666 | 2.789 | 2.596 | 0.035 | 2.664 | 0.033 |
| O1(ppsC)···OH(Ser-275) | 2.53 | 2.717 | 2.707 | 2.751 | 2.673 | 0.022 | 2.704 | 0.027 |
| O1(ppsB)···(Arg-209) | 2.61 | 2.691 | 2.696 | 2.755 | 2.657 | 0.020 | 2.692 | 0.019 |
| O2(ppsB)··NE(Arg-209) | 3.32 | 2.702 | 2.754 | 3.006 | 2.702 | 0.048 | 2.741 | 0.034 |
The NH group at ring B forms a stable hydrogen bond to the carbonyl group of Asp-194, as already observed in other phytochrome structures. Unique for the Pfr state of PaBphP, however, is the strong hydrogen bond between the carboxylic group of this residue and the NH group on ring D. Interestingly, the QM treatment of Asp-194 (QM96/MM) leads to an elongation of the N(D)···O(Asp-194 side chain) distance by ∼0.2 Å compared with the QM81/MM model. This bond seems to be an important factor to stabilize the ZZEssa configuration of the BV cofactor. In fact, a D194A mutation impairs the complete photoconversion of the photoreceptor (14).
In addition to Asp-194, Ser-459 and Gln-188 also have been suggested to contribute to the chromophore stabilization via interaction with the carbonyl function of ring D (14). In fact, the present calculations predict average distances of 3.4 Å (O(D)···O(Ser-459)) and 3.25 Å (O(D)···NE(Gln-188)), which are smaller than the crystallographic data of 4.1 and 3.4 Å, respectively. Mutations of these two residues also lead to irregularities (S459A) or delay (Q188L) in the photocycle (14).
Both the NH groups of rings A and C form strong hydrogen bonds to the pyrrole water located in the tetrapyrrole cavity, as indicated by the short distances of 2.90 and 2.86 Å, respectively. In contrast to previous studies on phyA (48), the interactions of this water molecule are preserved during the entire MD simulation. Rotation of the pyrrole water is hindered by the strong hydrogen bond formed with His-247.
The positions of both BV propionic side chains hardly change within the 50 snapshots. In the case of the ring C propionic chain, hydrogen bonds with His-277, Tyr-163, and Ser-275 immobilize the carboxylic group. Particularly steady and strong are the interactions with Ser-275 and Tyr-163, as reflected by the short average distances of 2.70 and 2.66 Å for O(Ser-275)···O2(ppsC) and O(Tyr-163)···O1(ppsC), respectively. Correspondingly, the mobility of the ring B propionic side chain is hindered by the two strong hydrogen bonds with Arg-209. For these interactions, the average N(Arf-209)···O1(ppsB) and NE(Arg-209)···O2(ppsB) distances are 2.70 and 2.75 Å, respectively (Table 1).
Resonance Raman Spectra of PaBphP
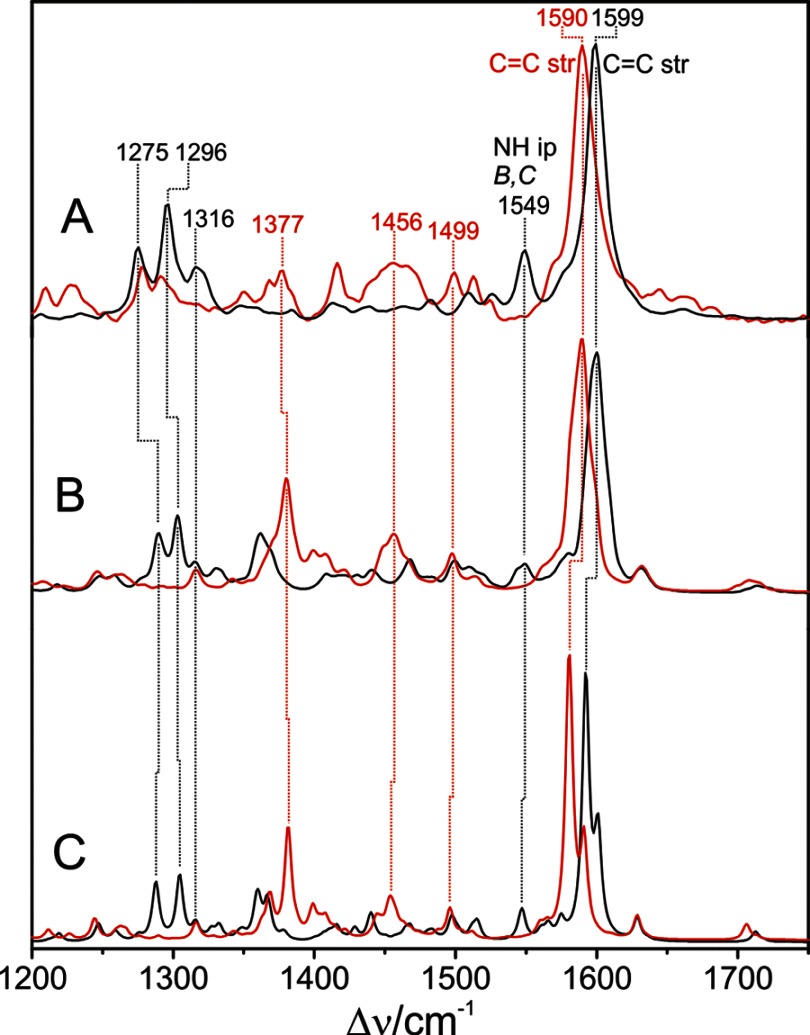
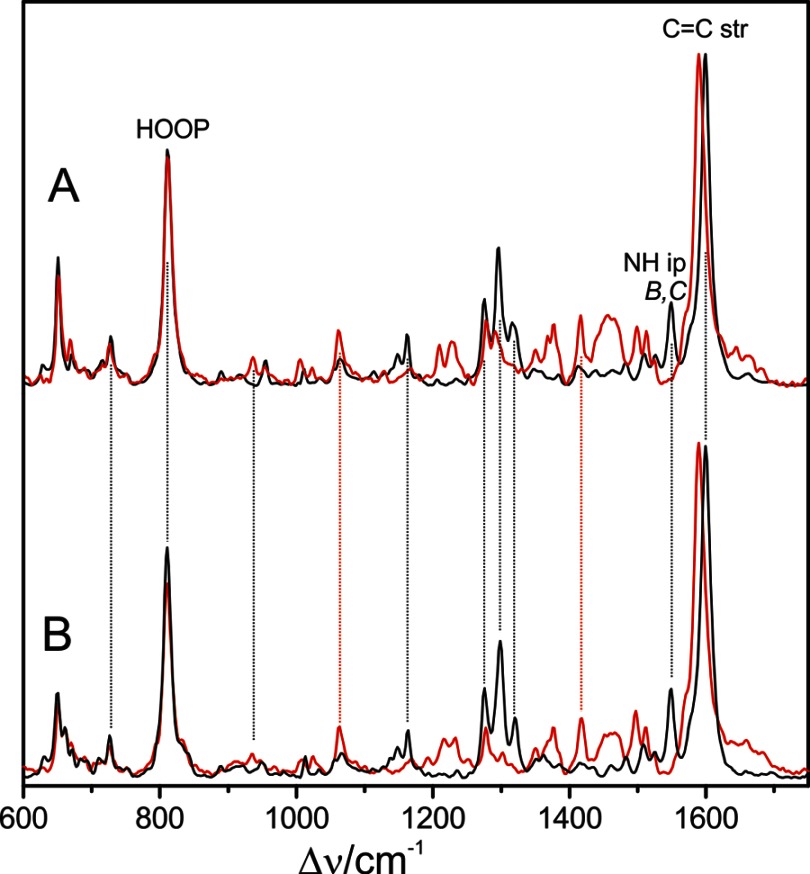
The experimental RR spectrum of PaBphP in the Pfr state is characterized by two strong peaks located at 1599 cm−1 and at 811 cm−1 (Figs. 4 and 5). Although the first peak constitutes a well known marker band for the tetrapyrrole backbone conformation, the high intensity of the second peak is characteristic for tetrapyrrole chromophores in the Pfr state. In addition, the presence of the band at 1549 cm−1, which is sensitive to H/D exchange, is indicative of a protonated tetrapyrrole, as already demonstrated by previous spectroscopic studies on phytochromes (58, 59).
FIGURE 4.
Experimental RR and calculated Raman spectra of the Pfr state of PaBphP in H2O (black) and D2O (red) between 1200 and 1750 cm−1. A, experimental RR spectrum; B, sum of the QM96/MM-calculated Raman spectra obtained from various snapshots of the MD simulations; C, calculated Raman spectrum for the QM/MMmin model.
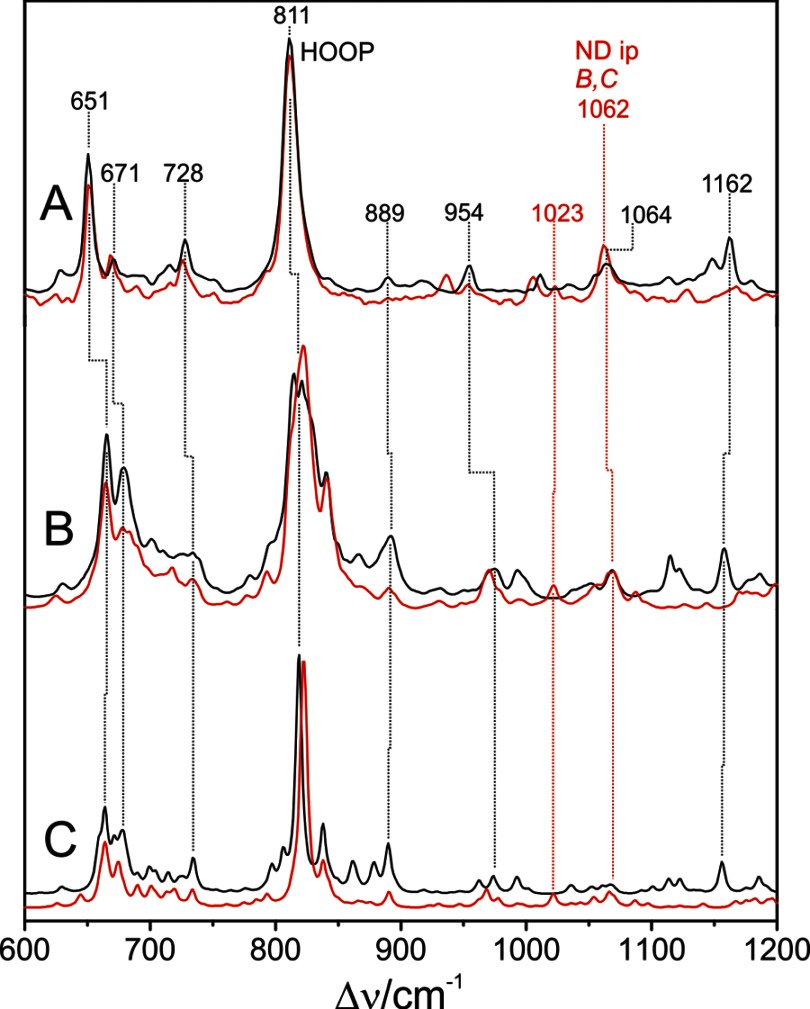
FIGURE 5.
Experimental RR and calculated Raman spectra of the Pfr state of PaBphP in H2O (black) and D2O (red) between 600 and 1200 cm−1. A, experimental RR spectrum; B, sum of the QM96/MM-calculated Raman spectra obtained from various snapshots of the MD simulations; C, calculated Raman spectrum for the QM/MMmin model.
The Raman spectrum computed for the BV chromophore bound to PaBphP using the large QM96/MM model is in very good overall agreement with the experimental spectrum. An intense Raman band is predicted at ∼1601 cm−1, resulting from the superposition of two peaks, calculated on average at 1602 and 1600 cm−1 (Table 2). This finding is in line with the experimental data because the 1599-cm−1 band is actually composed of two band components at 1603 and 1598 cm−1 (see below) (Table 2). Analogous to other phytochromes, these two modes are assigned to C=C stretching vibrations at the A-B and C-D methine bridges, with the C=C(A-B) at a higher frequency than the C=C(C-D). Minor structural variations at the methine bridges observed among snapshots (Table 1) give rise to frequency shifts for these two modes of more than 20 cm−1 (Table 2).
TABLE 2.
Assignment of experimental vibrational frequencies (ν/cm −1) and relative Raman intensities measured for PaBphP, Agp2, and Agp1 phytochromes according to the calculated vibrational modes and relative Raman intensities for PaBphP-BV and PaBphP-PΦB minimum energy QM96/MM models and average frequencies with corresponding standard deviation of PaBphP-BV computed out of a 50-snapshot ensemble
The abbreviations used are as follows: PED, potential energy distribution; str, stretching; rock, rocking; def., deformation, Δν (13C), frequency shift due to 13C labeling of the C(10) position. A, B, C, and D refer to the respective pyrrole rings, and A-B, B-C, and C-D denote the corresponding methine bridges (see Fig. 1). The experimental (exp.) and calculated (calc.) relative Raman intensities (I) are related to the strongest band (I = 100).
| Mode no. | Calc. modes (QM96/MM) for PaBphP-BV |
Exp. PaBphP |
Exp. Agp2 |
Exp. Agp1 |
Calc. modes for PaBphP-PΦB |
|||||||||
|---|---|---|---|---|---|---|---|---|---|---|---|---|---|---|
| Minimum energy snapshot |
Average ν | ν | I | ν | I | ν | Δν (13C) | I | Minimum energy snapshot |
|||||
| PED (%) | ν | I | ν | I | PED (%) | |||||||||
| 50 | 46% C = C str vinyl D | 1629 | 8 | 1632 ± 3 | 1613 | 8 | 1614 | 8 | 1633 | 0 | 6 | 1627 | 8 | 45% C = C str vinyl D |
| 10% C--C str D-vinyl | 10% C--C str D-vinyl | |||||||||||||
| 12% C--H rock vinyl D | 12% C--H rock vinyl D | |||||||||||||
| 11% C--H def vinyl D | 11% C--H def vinyl D | |||||||||||||
| 51 | 61% C = C str A | 1611 | 0 | 1609 | 3 | |||||||||
| 52 | 38% C = C str A-B | 1602 | 38 | 1602 ± 5 | 1603 | 42 | 1605 | 45 | 1620 | −1.6 | 39 | 1589 | 89 | 16% C = C str A-B |
| 1611 | −3.4 | 33 | 13% C = C str B-C | |||||||||||
| 53 | 46% C = C str C-D | 1592 | 100 | 1600 ± 5 | 1598 | 100 | 1598 | 100 | 1600 | +0.3 | 100 | 1595 | 100 | 46% C = C str C-D |
| 1595 | −2.9 | 21 | ||||||||||||
| 54 | 35% C = C/C-C str B-C | 1574 | 7 | 1577 ± 4 | 1585 | 8 | 1588 | 13 | 1586 | −5.7 | 19 | 1566 | 15 | 11% C = C str A-B |
| 13% C--H def B-C | 1577 | −11.0 | 9 | |||||||||||
| 55 | 52% C--C str D | 1561 | 3 | 1575 | 11 | 1577 | 12 | 1560 | 5 | 47% C--C str D | ||||
| 13% C = C str vinyl D | 12% C = C str vinyl D | |||||||||||||
| 56 | 26% N-H ip B | 1548 | 12 | 1548 ± 4 | 1549 | 31 | 1549 | 35 | 1551 | −0.2 | 35 | 1546 | 17 | 22% N--H ip B |
| 21% N-H ip C | 22% N--H ip C | |||||||||||||
| 165 | 69% HOOP C-D | 819 | 36 | 822 ± 8 | 811 | 809 | 819 | 52 | 63% HOOP C--D | |||||
| 803 | ||||||||||||||
The NH in-plane (ip) deformation mode of rings C and B (ν56) is predicted at 1548 cm−1 with a significant Raman intensity, again in very good agreement with the experimental peak detected at almost the same position. In addition, the NH ip deformation coordinate of ring B also contributes to several modes in the frequency region at ∼1300 cm−1. Deuteration of the NH groups leads to three main spectral changes. The N-H bending at 1549 cm−1 disappears, and its counterpart re-appears at 1062 cm−1. The band at 1316 cm−1, located in a crowded spectral region, loses intensity, and a new peak at 1377 cm−1 appears in the spectrum of the deuterated species. As shown in Figs. 4 and 5, these isotopic spectral changes are well reproduced by the calculations.
Most remarkably, the standard deviation for ν56 (N-H ip B and C) frequency is only 4 cm−1 (Table 3), which is much lower than that predicted for phyA (9 cm−1) (48), reflecting the positional and rotational stability of the pyrrole water and the Asp-194 in the chromophore cavity. The NH in-plane deformation coordinates of rings A and D are distributed over several normal modes around 1370 and 1440 cm−1, respectively, which are in most cases predicted with low Raman intensity. Hence, a direct assignment of an experimental RR peak to these vibrational modes is not possible.
TABLE 3.
Experimental and calculated vibrational frequencies (ν/cm−1) of PaBph-BV using the QM/96/MM and QM81/MM models
Average frequencies and corresponding standard deviation were computed out of a 50-snapshots ensemble. The abbreviations used are as follows: avg., average; min., minimum; Exp., experimental; sh, shoulder; vs, very strong intensity; m, medium intensity.
| Mode | Character | Exp. | QM96/MM |
QM81/MM average | |||
|---|---|---|---|---|---|---|---|
| Min. | Avg. | Range | r.m.s.d. | ||||
| 50 | C = C (vinyl) | 1613 (sh) | 1629 | 1632.2 | 13.9 | 3.2 | 1631.1 |
| 52 | C = C (A-B) | 1603 (vs) | 1602 | 1602.3 | 19.8 | 5.0 | 1600.6 |
| 53 | C = C (C-D) | 1598 (vs) | 1592 | 1599.7 | 21.0 | 5.1 | 1603.9 |
| 54 | C = C (B-C) | 1585(sh) | 1574 | 1577.0 | 20.8 | 4.1 | 1577.7 |
| 56 | NH ip (C, B) | 1549(m) | 1548 | 1547.8 | 16.9 | 3.9 | 1548.5 |
| 165 | HOOP (C-D) | 811 (vs) | 819 | 821.8 | 39.2 | 7.6 | 842.4 |
The lower frequency region is dominated by a very intense band at 811 cm−1. In accordance with previous vibrational assignments for other phytochromes, the present calculations predict an intense band in this region that is due to the hydrogen out-of-plane (HOOP) vibration of the C-D methine bridge. The average vibrational frequency calculated for this mode is higher by 10 cm−1 than the experimental value. If Asp-194 is excluded from the QM region (model QM81/MM), the discrepancy with respect to the experimental position increases to 30 cm−1 (Table 3). Unlike the high frequency region, for which the QM81/MM model also affords satisfactory results, the quantum mechanical treatment of the BV-Asp-194 and BV-H2O interactions is essential for reproducing the HOOP modes in an adequate manner. In this last model, for only one snapshot structure a HOOP frequency below 810 cm−1 was predicted; 42 snapshots exhibit HOOP frequencies between 810 and 830 cm−1 and seven of them with HOOP frequencies slightly above 830 cm−1. Furthermore, for the QM96/MM model the frequency variations are correlated with the C-15=C-16 torsional angle (see below), and a relationship between the HOOP frequency and any structural parameter could not be identified for the QM81/MM model.
A second experimental peak of considerable intensity in the low frequency region is located at 651 cm−1 close to a smaller peak at 671 cm−1. From the calculated potential energy distribution the former band was assigned to a mode consisting mainly of ring D bending vibrations with only minor contributions from the thioether bridge C–S stretching, although the latter peak includes various coordinates such as ring C bending and a relatively high contribution from the C–S stretching.
Correlation between Spectral and Structural Parameters
Although the average QM/MM spectra calculated from 50 snapshots match the experimental data very well in most regions, the individual spectra show dispersion in frequencies that may be associated with particular structural changes. A quantitative analysis is possible by Pearson's method (60), which allows evaluating cross-correlations for mode frequencies and structural parameters as discussed in the following for the QM96/MM model.
Particularly for the structural changes of the BV cofactor occurring at the methine bridges,- we computed moderate or strong correlation of the C–C dihedral angle with the C=C bond length of 0.59 for B-C and −0.80 for C-D, respectively. This can readily be rationalized because the torsional motion has an impact on the electronic structure of the conjugated C=C bonds of the methine bridges that affect the orbital overlap and thus the methine bridge bond length. As a consequence, the frequencies of the C=C stretching modes of the methine bridges are not only inversely correlated with the respective bond lengths. The frequency of the C-D stretching, for example, is further correlated with the dihedral angle of the C-D bridge (0.59), whereas that of the A-B stretching displays a strong correlation with the C-5–C(B)–N(B) bond angle (0.64) (Table 4).
TABLE 4.
Pearson correlation coefficients r for selected structural and vibrational parameters of the PaBphP-BV chromophore calculated for the QM96/MM model
Only values above 0.50 are reported. The abbreviation used is as follows: str, stretching.
| Structural parameter | Vibrational coordinate |
||||||
|---|---|---|---|---|---|---|---|
| C=C str A-B | C=C str B-C | C=C str C-D | N–H ip A | N–H ip B, C | HOOP C-D | ||
| A-B methine bridge | C(5)–C(6)–N(B) bond angle | 0.64 | 0.57 | 0.64 | |||
| C (5)–C (6) bond length | −0.86 | −0.58 | |||||
| B-C methine bridge | N(B)–C(9)–C(10) bond angle | 0.64 | 0.61 | 0.57 | 0.61 | ||
| C (9)–C (10)–C (11) bond angle | 0.55 | ||||||
| C (9)–C (10) bond length | 0.50 | ||||||
| C (10)–C (11) bond length | −0.66 | ||||||
| C-D methine bridge | N(C)–C(14)–C(15)–C(15) dihedral angle | 0.59 | |||||
| C(14)–C(15)–C(16)–N(D) dihedral angle | −0.65 | ||||||
| C (15)–C (16) bond length | 0.89 | ||||||
Also, the frequency of the prominent C-D methine bridge HOOP mode is significantly correlated with a structural parameter, the C-15=C-16 torsional angle (0.65), such that deviations from co-planarity between rings C and D cause increasing frequencies. Only a moderate correlation exists for the C-14 C-15 dihedral angle (0.45). Furthermore, a high positive correlation of the N-H ip (B and C) and C=C stretching frequencies was evaluated for both the A-B and B-C methine bridge (0.75 and 0.57), although at least a weak positive correlation exists for the C-D bridge (0.24). These findings are consistent with the coupling of the two vibrational modes as derived from the computed potential energy distribution and also with the experimental shifts of the A-B, B-C, and C-D C=C marker bands upon H/D exchange of the pyrrole nitrogens (see Fig. 5).
Model for PaBphP with a 2(R),3(E)-PΦB Chromophore
Previous crystallographic studies on the Pr state of prototypical BV-binding phytochromes (18, 24) have shown that the tetrapyrrole is covalently bound to the Cys via a thioether linkage with the terminal C-32 carbon of the vinyl group of ring A, thereby leading to an exocyclic C=C double bond and a chiral center at the C-2 carbon. Correspondingly, the bound chromophore exhibits the ligation adduct of a 2(R),3(E)-PΦB-type structure (Fig. 1). Instead, the crystallographic analysis of the bathy phytochrome PaBphP provides no indication for a chiral center at the C-2 carbon (14) but indicates a BV-type chromophore configuration with an intra-ring double bond, although the limited resolution of the electron density map at the chromophore-binding site leaves some uncertainties. Thus, we have checked this conclusion by extending the calculations to a new structural model that was generated by exchanging the BV chromophore of the crystal structure-based QM96/MM models with a 32-linked 2(R),3(E)-PΦB. The methyl group at ring A was oriented toward Ile-246 and Leu-9 to avoid steric clashes with the protein environment, in particular with Ser-193. The new geometries were reoptimized following the same procedure as described above for the QM96/MM models. To distinguish them from the original models, we will refer to them as QM96-PΦB/MM.
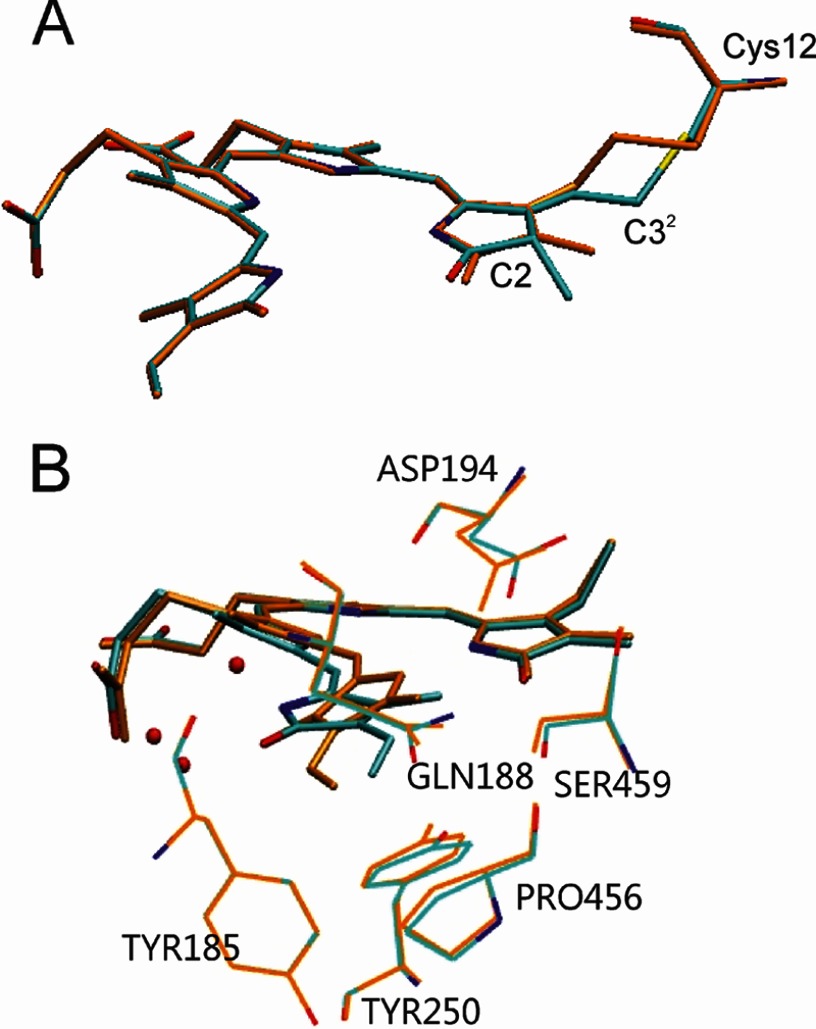
In fact, comparison between the QM96/MM and QM96-PΦB/MM model suggests that the structural differences at this linkage site and its immediate environment are minor and most likely not detectable at 2.9 Å resolution, especially by the limited information of the electron density from the chromophore in PaBphP (14). The r.m.s.d. between the two minimum energy structures yielded only 0.3 Å. The largest structural differences compared with the original model are predicted for C-32 and at the methyl group on C-2 which are displaced by 1.45 and 1.03 Å, respectively, as a consequence of hybridization change at C-31 and C-2. The concomitant changes in the electron distribution in ring A induce a significant swap of the C-2–C-3–C-31–C-32 dihedral angle from −63 to 3° (Fig. 6).
FIGURE 6.
Superposition of the minimum energy structure of PaBphP bonded to a BV-type chromophore in the ZZEssa conformation (orange) and the structure of PaBphP bonded to a 2(R),3(E)-PΦB chromophore (cyan) (A) and the structure PaBphP with BV in a ZZZssa conformation (cyan) (B).
As a consequence, the main effect in the calculated Raman spectrum refers to the A-B stretching mode, which undergoes a significant 11-cm−1 downshift such that it appears as a separate peak on the low frequency side of the largely unchanged C-D stretching mode (Table 2 and Fig. 7). The downshift is even more pronounced in the spectra calculated for the minimum energy configurations of the models. Further spectral differences originating from the PΦB-type constitution of the chromophore include the broad feature at 1370 cm−1 and the peak at 717 cm−1 (Fig. 7), which are due to a deformation and stretching of the C–S bond, respectively, and the two weak bands at 1645 and 1197 cm−1 resulting from the stretching of the exocyclic C=C bond and the C–C and C–N single bond stretchings, respectively. The rather significant spectral deviation related to the A-B methine bridge stretching of the QM96-PΦB/MM model from the experimental spectrum prompt us to discard the idea of a PΦB-type chromophore and thus supports the conclusions drawn by Yang et al. (14) that the tetrapyrrole is bound under preservation of the ring A C=C double bound, i.e. a BV-type chromophore as used in the QM96/MM model.
FIGURE 7.
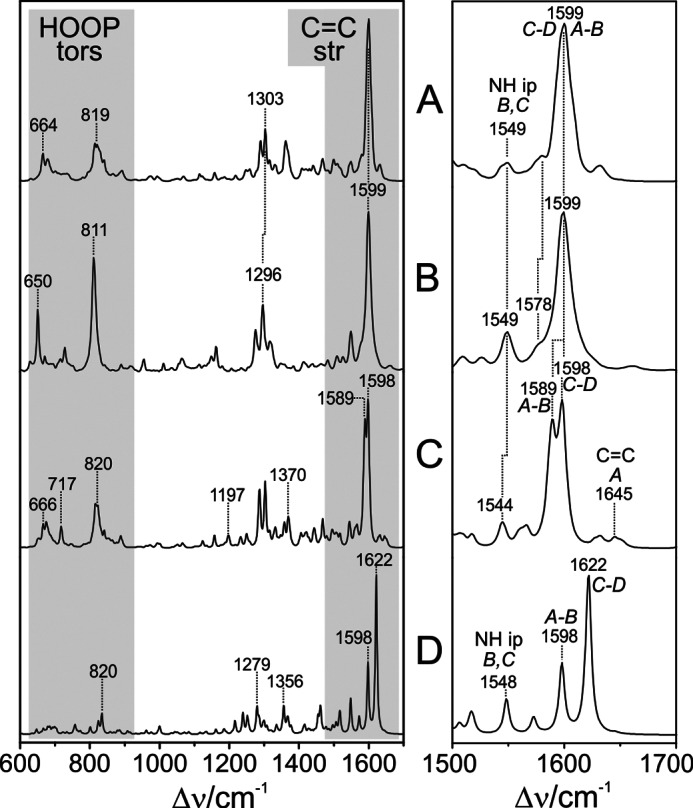
A, calculated Raman spectrum of the Pfr state of PaBphP with a BV-type chromophore binding in the ZZEssa configuration (sum of snapshots, as in Figs. 4 and 5); B, experimental RR spectrum of the Pfr state of PaBphP; C, calculated Raman spectrum of the Pfr state of PaBphP with PΦB-type chromophore binding in the ZZEssa configuration (sum of snapshots); D, calculated Raman spectrum of the Pfr state of PaBphP with a BV-type chromophore binding in the ZZZssa configuration (single snapshot). The left panel displays the overview spectra, highlighting the most structure-sensitive spectral regions. The right panel is an expanded view of the C=C stretching region.
Model for PaBphP with BV in ZZZssa Configuration/Conformation
The second consequence of the limited resolution of the electron density at the BV-binding site of PaBphP refers to the determination of the configuration of the C-D methine bridge. Although the electron density would also be compatible with a Za configuration at this position, Yang et al. (14) decided for the more plausible Ea configuration, based on the hydrogen bonding network between ring D and the protein environment. This conclusion was backed by further crystallographic studies (15, 20). To examine the consequences of the ZZZssa cofactor configuration on the Raman spectra, we have generated a structural model for PaBphP with a BV in 15Za configuration (PaBphP-15Za), using the optimized QM96/MM structure as a starting point and rotating the C=C double bond of the C-D methine bridge clockwise to ∼140° thus avoiding sterical clashes with the protein environment. The system was allowed to relax following the QMMM protocol described under “Material and Methods.”
As shown in Fig. 6, the main differences of the optimized structure with respect to the starting geometry are noted for the C-D methine bridge of the BV cofactor, characterized by torsional angles of −162.1 and 9.6° for the C=C and C–C bonds, respectively. Except for the slightly rotated side chain of Gln-188 and the movement of the Asp-194 side chain closer to the chromophore, the positions of the remaining residues in the vicinity of ring D are hardly affected. In the PaBphP-15Za structure, however, the hydrogen bonds between ring D and the Tyr-250, Ser-459, Gln-188, and Asp-194 no longer exist. Instead, the NH and CO groups of ring D interact with water molecules. These structural differences lead to distinct changes in the calculated Raman spectrum that deviate substantially from the experimental spectrum (Fig. 7). The C=C stretching of the C-D methine bridge is calculated to be at 1621 cm−1, upshifted by 20 cm−1 with respect to the experimental band. Furthermore, the sharp peaks at 1296 and at 811 cm−1 in the experimental spectrum, assigned to the NH ip deformation mode at ring B and to the HOOP on the C-D methine bridge, respectively, are not reproduced by the PaBphP-15Za model, in contrast to the good overall agreement provided by the calculated spectrum of the PaBphP-15Ea model. Consequently, the present spectroscopic analysis confirms the ZZEssa chromophore configuration proposed by Yang et al. (14).
Structural Similarities between PaBphP and Agp2
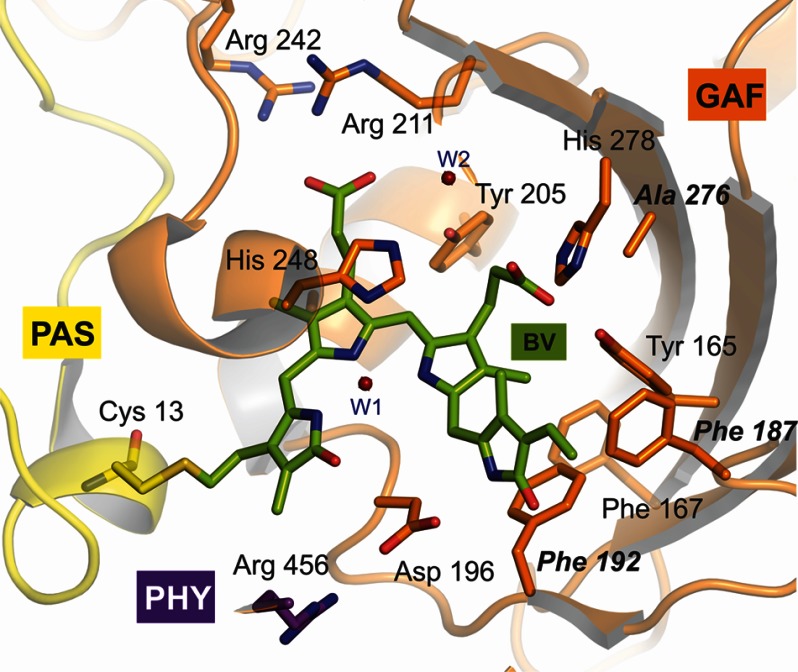
Agp2 is a bathy phytochrome from A. tumefaciens. The RR spectra of the Pfr states of Agp2 and PaBphP are nearly identical with respect to the frequencies and relative intensities and the isotopic shifts upon H/D exchange (Fig. 8). This striking spectral agreement indicates that the structures of the chromophore binding pockets are very similar. In fact, whereas the overall sequence homology between the photosensory modules (∼513 amino acids) of Agp2 and PaBphP shows around 37% identity and 56% similarity (EMBOSS-Align; EMBL-EBI), nearly all amino acids in the chromophore binding pocket are conserved with the exception of Phe-187, Phe-192, and Ala-276 in Agp2 compared with Tyr-185, Tyr-190, and Ser-275 in PaBphP. Thus, a basic homology model of Agp2 displays only minor differences compared with the PaBphP template (Fig. 9).
FIGURE 8.
Experimental RR spectra of the Pfr states of PaBphP (A) and Agp2 in H2O (black) and D2O (red) (B).
FIGURE 9.
Homology model for the Pfr state of Agp2. Bold letters refer to Agp2-specific amino acids compared with PaBphP.
Pfr States in Bathy and Prototypical Phytochromes
The RR spectra of Pfr states of prototypical phytochromes display distinct differences compared with those of bathy phytochromes, specifically in the region of the C=C stretching and the HOOP modes of the methine bridges (Fig. 10). This is shown for the prototypical phytochrome from A. tumefaciens, Agp1 (Fig. 10C), two Agp1 mutants (Fig. 10, D and E), and the cyanobacterial BV-binding phytochrome CphB (Fig. 10F). All spectra show the characteristic features of the Pfr state, i.e. intense RR bands at ∼1600 and 800 cm−1. However, in the spectra of prototypical phytochromes, these bands do not exhibit symmetric band profiles. The prominent C=C stretching band displays pronounced shoulders on the high frequency side of between ∼1605 and 1630 cm−1, concomitant to a broadening and increased asymmetry of the band shape for all bands in this region as compared with the relatively sharp 1599-cm−1 peak of the bathy phytochromes Agp2 and PaBphP. In the HOOP region, a similar broadening and peak shape asymmetry were observed, and in CphB even a clearly detectable second peak was observed, although not as pronounced as for the C=C stretching modes. These changes were accompanied by an increased RR activity for the modes in the region between 840 and 860 cm−1, where for bathy phytochromes Raman bands can hardly be detected at all. It is therefore tempting to assume that the spectral heterogeneities in the Pfr spectra of prototypical phytochromes reflect a structural heterogeneity of the chromophore binding pocket. To examine this hypothesis, we have investigated the C=C stretching and HOOP regions of WT Agp1 in more detail.
FIGURE 10.
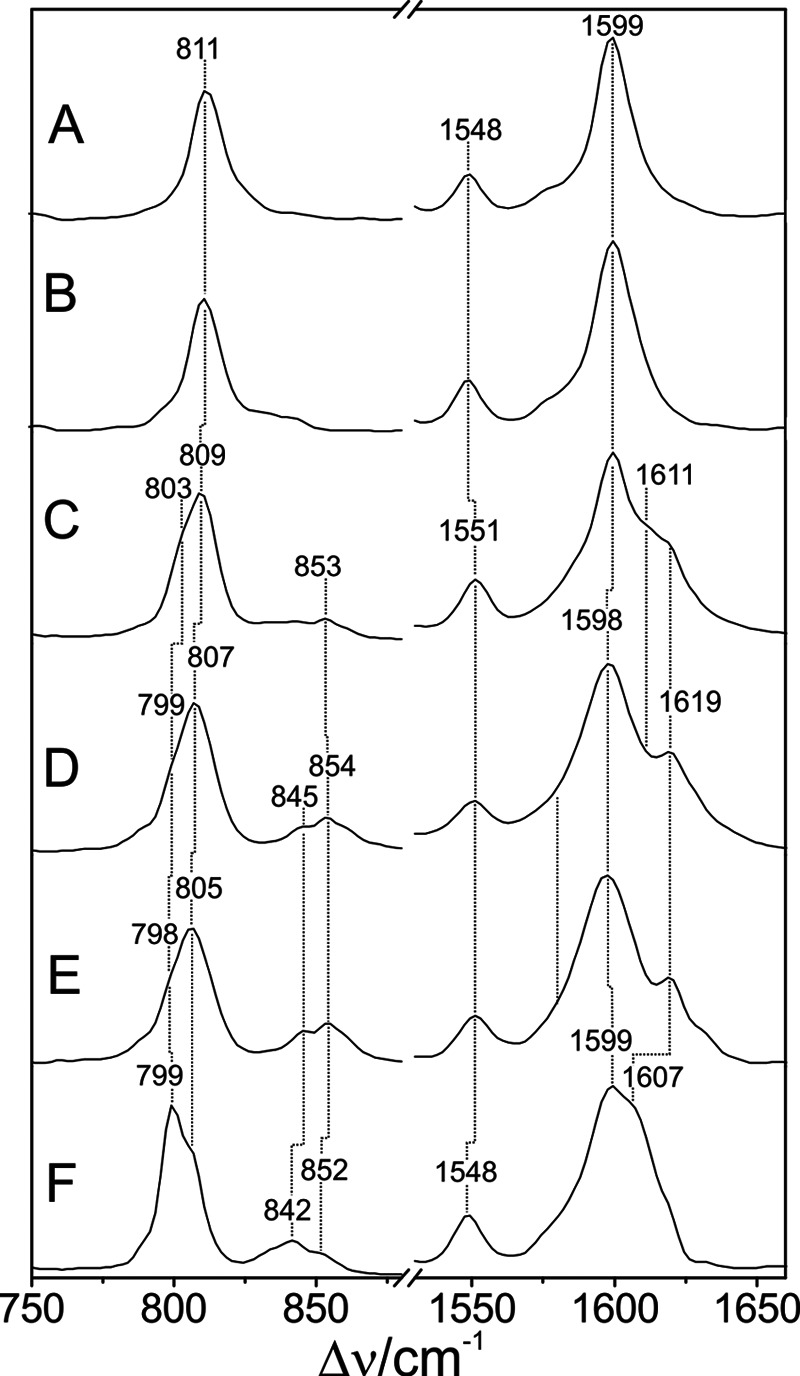
Experimental RR spectra of the Pfr states (in H2O) in the C=C stretching (right) and HOOP region (left) of PaBphP (A), Agp2 (B), Agp1 (C), Agp1-Δ18 (D), Agp1-C20A (E), and CphB (F).
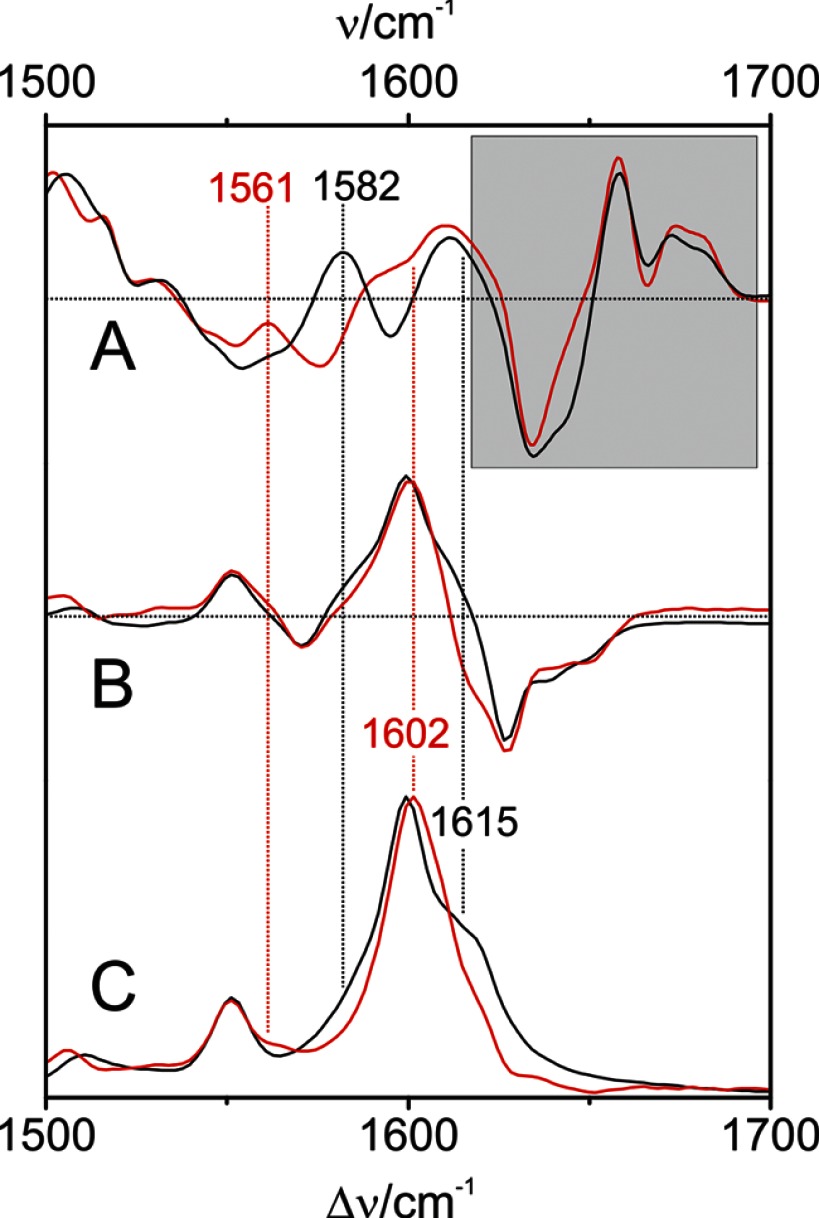
First, we tried to identify the nature of the vibrational modes in the C=C stretching region, using Agp1 reconstituted with a BV chromophore with a 13C/12C substitution at the B-C methine bridge. This substitution affects the modes, including the B-C stretching coordinates that according to the calculations for PaBphP predominantly contribute to the weakly Raman-active mode ν54 (Table 2). As this mode is expected to exhibit a high IR intensity, the RR spectroscopic measurements were complemented by IR difference spectroscopy. Such IR difference spectra reflecting the spectral changes associated with the Pr to Pfr transition are shown in Fig. 11A for Agp1, including the nonlabeled and 13C-labeled BV chromophore. The spectral features in the shaded area of Fig. 11 are primarily due to difference bands of the protein and the chromophore in the Pr state, but the positive bands between 1550 and 1620 cm−1 can be attributed mainly to chromophore bands of the Pfr state. Here, the most pronounced isotopic shift is observed for the peak at 1582 cm−1, which upon 13C labeling is downshifted to 1561 cm−1. These bands can hardly be detected in the RR (Fig. 11C) and the “Pfr minus Pr” RR difference spectra. However, the RR (difference) spectra indicate a substantial loss of intensity on the high frequency shoulder (∼1615 cm−1) of the prominent 1600-cm−1 peak upon 13C labeling indicating the involvement of the B-C stretching coordinates to the RR-active mode(s) in this region. Thus, the isotopic shifts point to two different modes with a substantial B-C stretching character. The present data for PaBphP and previous experimental results for other phytochromes as well as QM/MM and QM calculations (Table 2) (61) have shown that the B-C stretching coordinates may be either largely localized in one mode (ν54 of PaBphP) or distributed over two modes via coupling with the A-B stretching coordinates. In the latter case, one expects a lower frequency IR-active and a higher frequency Raman-active mode, both of them sensitive to 13C labeling at position C-10, which nicely agrees with the present observations for Agp1.
FIGURE 11.
Experimental IR and RR spectra of Agp1 in H2O. A, IR difference spectra “Pfr minus Pr”; B, RR difference spectra “Pfr minus Pr”; and C, RR of the Pfr state. Black lines and numbers refer to Agp1 reconstituted with the unlabeled chromophore, and red lines and numbers refer to the chromophore 13C-labeled at position C-10; the shaded area indicates Pr and protein difference bands.
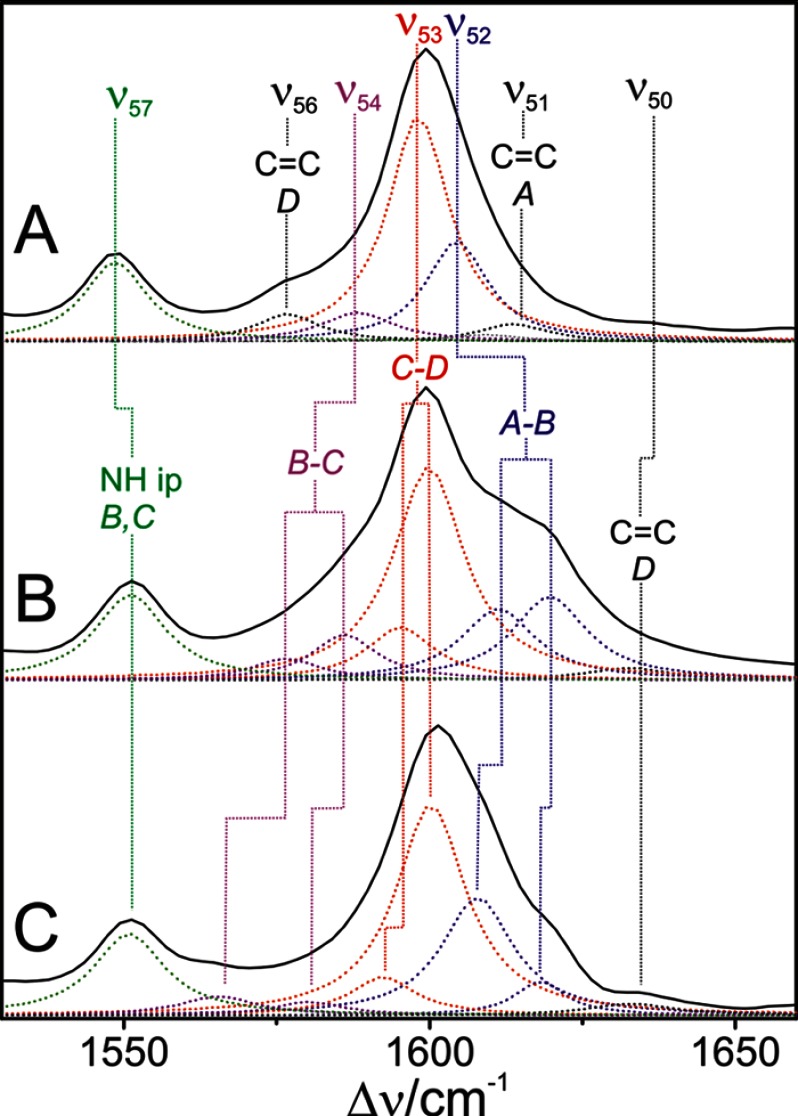
On the basis of these results, the RR spectra of PaBphP and Agp2 were subjected to a band fitting analysis, using a minimum number of bands to achieve a satisfactory simulation of the experimental spectra with physically meaningful widths of the individual band components (Fig. 12). The results agree very well with the calculations for PaBphP inasmuch as all of the predicted Raman-active modes of the cofactor can be correlated with counterparts in the experimental spectra with a good match in frequencies and intensities (Table 2).
FIGURE 12.
RR spectra in the C=C stretching region of Agp2 (A), Agp1 reconstituted with the unlabeled chromophore (B), and Agp1 reconstituted with the chromophore 13C-labeled at position C-10 (C). The spectra were measured from protein solutions in H2O. The dotted lines refer to fitted Lorentzian line shapes. Band components originating from modes of similar character are highlighted by different colors.
The corresponding analysis of the RR spectrum of Agp1 requires more bands for an acceptable fit than Agp2 (and PaBphP) (Fig. 12). To correlate these bands with the expected normal modes in this region, we have to take into account that in Agp1, like in bacteriophytochrome 1 from Deinococcus radiodurans (18), the BV chromophore binds to the Cys side chain via a PΦB-type configuration such that no mode involving the ring A C=C stretching (ν51 in Agp2) exists. The corresponding stretching mode of the exocyclic double bond is predicted to be above 1640 cm−1 with very low RR activity. It might contribute to the very weak band at 1633 cm−1, although the assignment to the C=C stretching of the vinyl substituent of ring D seems to be more plausible in view of its coupling to the delocalized π-electron system of the chromophore. The remaining six bands between 1560 and 1620 cm−1 then have to be related to four normal modes. A plausible assignment for these bands is guided by the isotopic shifts due to 13C labeling of the B-C methine bridge, the IR difference spectra (Fig. 11), and the predicted Raman activities (see above) (Table 2). Accordingly, the weak band pair at 1586 cm−1 (−6 cm−1) and 1577 cm−1 (−11 cm−1) is assigned to the weakly Raman-active mode ν54 (according to the notation for Agp2), whereas the medium intense band pair at 1611 cm−1 (−3 cm−1) and 1620 cm−1 (−2 cm−1) is attributed to the Raman-active mode ν54. Then the prominent band at 1600 cm−1, which does not display an isotopic shift, is assigned to the mode ν53 (C-D stretching). The same assignment may hold for the weak band component at 1595 cm−1, which is required for a satisfactory fit although its frequency (and isotopic shift) is associated with a considerable uncertainty.
In the same way, we have analyzed the HOOP region (Fig. 13). Although in the bathy phytochromes PaBphP and Agp2 the prominent peak at ∼810 cm−1 can be well described by a single Lorentzian band shape, in Agp1 two band components are required for a satisfactory fit. These two bands are insensitive to 13C labeling at the B-C methine bridge and thus confirm the assignment to the C-D HOOP mode.
FIGURE 13.
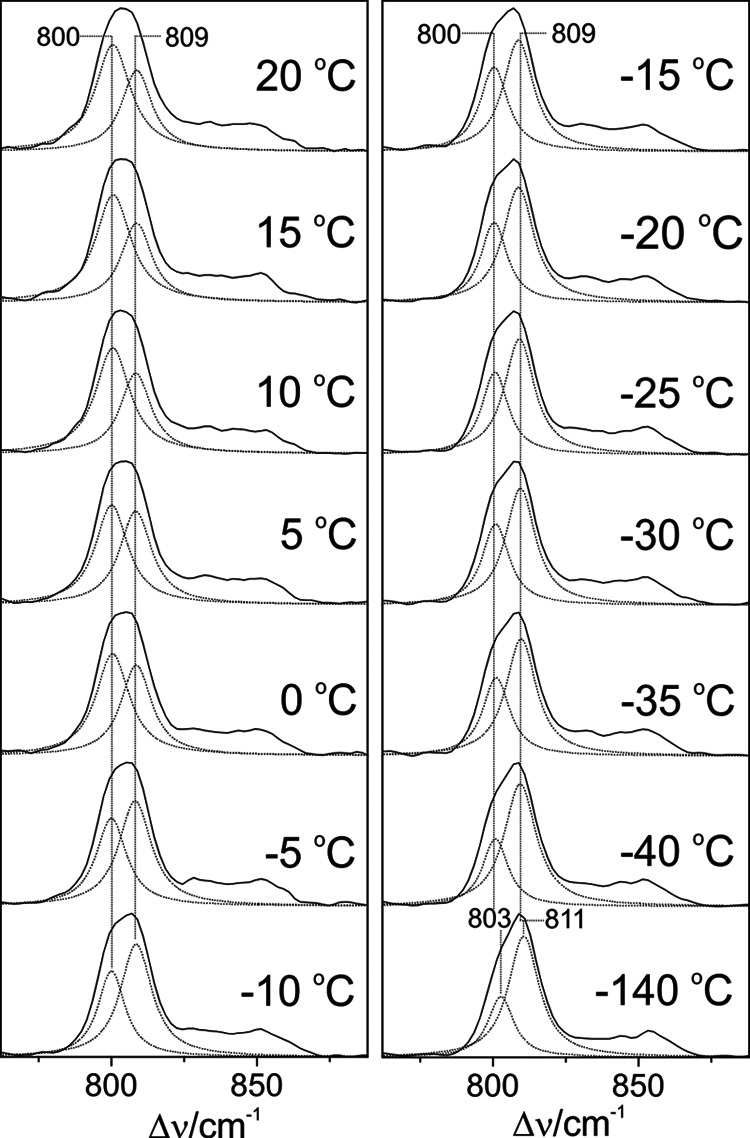
Temperature dependence of the RR spectra of the Pfr state of full-length Agp1. Residual Pr contribution of the Pfr state was manually subtracted using the raw Pr spectrum at each temperature. Subsequently, a minimum set of Lorentzian functions was fitted to the spectra. For the sake of clarity, only the two curves describing the HOOP modes are shown (dotted lines). Only restricted variations of the frequencies and bands widths (≤1 cm−1) were allowed in the global fit. The sum of the individual Lorentzians is essentially indistinguishable from the experimental spectrum (straight line). In an alternative approach, the fitting procedure was applied to the raw spectra by including band components originating from the Pr state determined before. Both fitting procedures afforded a very similar temperature dependence of the intensity ratio of the two HOOP modes, although there was a systematic underestimation of the lower frequency component in the latter approach (∼20%).
Structural Basis for the Differences between Bathy and Prototypical Phytochromes
The analysis of both spectral regions demonstrates the splitting of modes localized at the C-D and A-B methine bridges, indicating at least two sub-states that differ with respect to conformational details in these regions of the tetrapyrrole. To identify the underlying structural parameters, we adopted the results of the correlation analysis for PaBphP (see above and Table 4). Accordingly, we conclude that the splitting of A-B stretching mode reflects differences in the C-5–C(B)–N(B) bond angle and the C(A)=C-5 bond length. Both mode components are significantly higher in frequency than the corresponding mode in PaBphP, pointing to an increase of the bond angle associated with a shortening of the bond length in Agp1. Correspondingly, the splitting of the C-D stretching mode may be related to a subtle change of either the respective C=C bond length or, more likely, of the dihedral angle of the C-D methine bridge. The latter conclusion is supported by the analysis of the HOOP modes that include a prominent band at essentially the same position as in PaBphP and a second one at lower frequencies reflecting an increased C-15=C-16 torsional angle. The structural changes of the C-D moiety may also be the origin for the increased RR activity for bands between 840 and 855 cm−1 in Agp1, which are tentatively attributed to modes including the C-C and C-N stretching coordinates of ring D, according to the calculations for PaBphP.
Also the two mutants of Agp1, Agp1-Δ18 and Agp1-C20A, display a similar heterogeneity of the HOOP mode as the WT protein, an even more pronounced RR activity in the 840–855-cm−1 region, and an increased broadening of the C-D stretching at 1598 cm−1, pointing to qualitatively similar structural differences at the C-D methine bridge (Fig. 10, D and E). However, the A-B stretching region is dominated by the high frequency component at 1619 cm−1, whereas the 1611-cm−1 band component can hardly be detected. Accordingly, one may conclude that in the two sub-states of both Agp1-Δ18 and Agp1-C20A, the conformation of the A-B methine bridge is essentially the same, and structural heterogeneity is largely restricted to the C-D methine bridge. In fact, the mutations in Agp1-Δ18 and Agp1-C20A that refer to the chromophore-binding site prohibit a covalent attachment of the tetrapyrrole to the protein (29) and thus may remove steric constraints from the A-B dipyrrolic unit such that the A-B methine bridge adopts only one conformation with a more relaxed geometry. Conversely, the specific cofactor-protein interactions associated with the structural heterogeneity of the C-D dipyrrolic unit do not seem to be affected by these mutations. These findings suggest that the structural changes at the A-B and C-D methine bridges may be independent of each other.
The Pfr state of CphB reveals a distinct splitting of the HOOP modes with an even slightly higher RR intensity of the low frequency component at 799 cm−1 compared with the 805-cm−1 band, pointing to nearly equal populations of sub-states differing with respect to the C-D methine bridge conformation. This conclusion is consistent with the two similarly strong band components at 1599 and 1607 cm−1, which are readily assigned to C-D methine bridge stretchings in view of their high RR intensities. The overall very broad and asymmetric peak envelope suggests the involvement of more than one A-B stretching mode of the high frequency side, although their positions cannot be determined precisely. Qualitatively similar spectral heterogeneities, albeit to a different extent for the CD and AB modes, are observed in the RR spectra of the Pfr states of the prototypical BV-binding phytochromes from D. radiodurans (62) and Aspergillus nidulans (63).
Conformational Equilibria of the Pfr states in Prototypical Phytochromes and Dark Reversion
The present results indicate that the Pfr states of prototypical phytochromes possess a heterogeneous chromophore structure with at least two sub-states that are protonated at all four pyrrole nitrogens but differ with respect to the conformations of the C-D and A-B methine bridges. This structural heterogeneity is in sharp contrast to the Pfr state of bathy phytochromes, which exhibits a well defined homogeneous chromophore structure. It is therefore tempting to relate this difference to the different thermal stability of the Pfr state of bathy and prototypical phytochromes. A plausible interpretation is based on a conformational equilibrium involving a highly stable sub-state and a “reactive” sub-state that represents the starting point for the thermal reaction pathway to the Pr state. Whereas in bathy phytochromes the nonreactive sub-state prevails, in prototypical phytochromes the reactive and nonreactive sub-states coexist in comparable amounts. In an attempt to explore the parameters controlling this equilibrium, we have measured the RR spectra of the Pfr state of Agp1 as a function of the temperature and the pH. Changing the pH from 6.0 to 9.0 had essentially no effect on the RR spectra implying that there are no (de-)protonable groups in this pH range that influence the chromophore structure (data not shown). Analysis of the temperature-dependent spectra is more complicated because the intrinsic temperature dependence of frequencies and band widths superimposes with a temperature-dependent shift of the conformational equilibrium. Nevertheless, increasing the temperature from −140 to 20 °C leads to a remarkable decrease of the high frequency shoulder at 1619 cm−1 in the methine bridge stretching region, paralleled by intensity changes of the HOOP modes. These spectral changes may be interpreted in terms of a re-distribution among the sub-states (Fig. 14). For a quantitative analysis, the HOOP region is more appropriate because only two overlapping bands are involved. The spectra reveal a steady increase of the low frequency HOOP component (803–800 cm−1) at the expense of the high frequency component (811–809 cm−1) upon increasing the temperature from −140 to 20 °C (Fig. 13). Assuming the same RR cross-sections for the HOOP modes of the two components, the intensity ratio determined by a band fitting analysis can be set equal to the concentration ratio K of the two sub-states. The van't Hoff plot, restricted to the measurements between −40 and 20 °C, affords a reaction enthalpy of ΔHR = 6.7 kJ/mol (Fig. 15). The small reaction enthalpy suggests that the two sub-states differ only by subtle structural details such as a difference in the C-D methine bridge torsional angle and minor modifications in the A-B methine bridge geometry as concluded from the frequency-structure correlations discussed above (Table 4). Also, the Pr state of prototypical phytochromes evidently includes a heterogeneous chromophore structure as inferred from a previous RR study of Agp1 and bacteriophytochrome 1 from D. radiodurans (25). However, for the Pr state of Agp1, the temperature-dependent variations in the RR spectra are much smaller than for the Pfr state with a change in the intensity ratio of conjugate bands of less than 10% in a temperature range from 20 to −140 °C (data not shown). Moreover, structural heterogeneity in phytochromes appears to be a quite general phenomenon as it has been suggested both for the Pr states of cyanobacterial and plant phytochromes as well as for cyanobacteriochromes, based on NMR spectroscopy and the analysis of the respective photoconversion processes (20, 64–69). However, in none of the cases can the heterogeneity be related to the efficiency of thermal Z/E isomerization (dark reversion).
FIGURE 14.
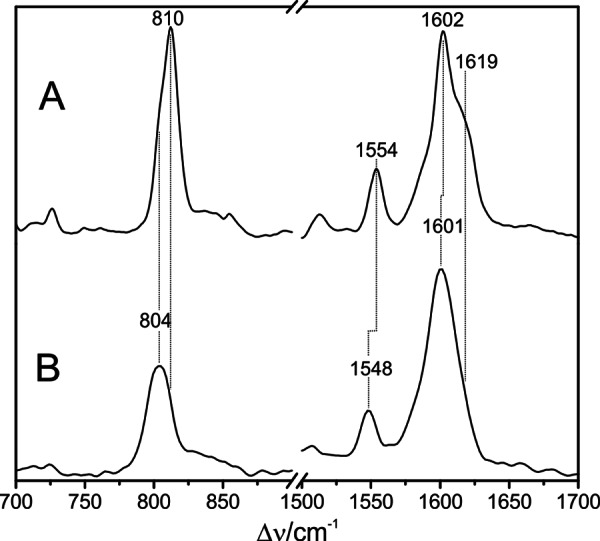
RR spectra of the Pfr state of full-length Agp1 measured at −140 °C (A) and 20 °C (1064 nm excitation) (B).
FIGURE 15.
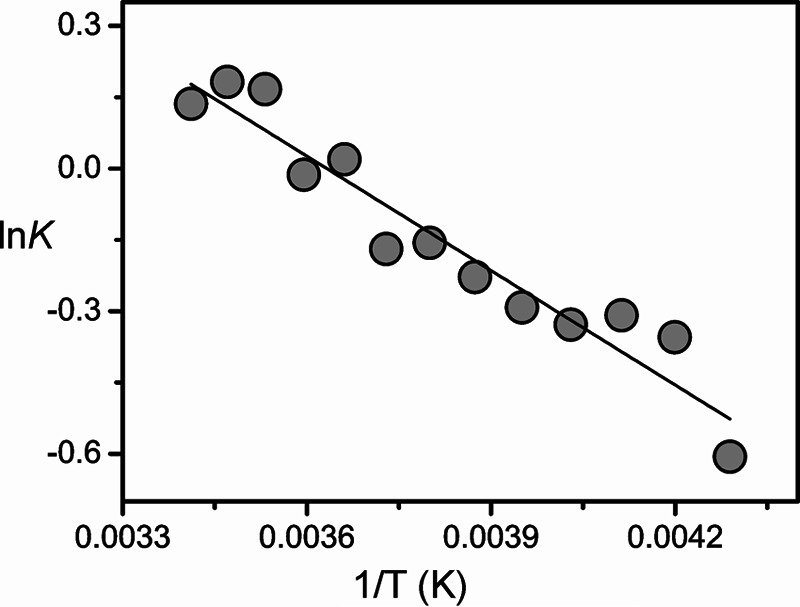
Plot of the logarithm of the equilibrium constant K for the conformational equilibrium in the Pfr state of Agp1 against 1/T. The equilibrium constant is defined by the intensity ratio of the low frequency (∼800 cm−1) to the high frequency (∼809 cm−1) band component of the prominent peak in the HOOP region. The intensities were determined by band fitting as described in Fig. 13.
In this context it is interesting to refer to recent NMR studies of the prototypical cyanobacterial phytochrome Cph1 (65). These authors have shown a less ordered chromophore pocket in the Pr state, whereas in the Pfr state the chromophore gives rise to well defined resonances with no indication for heterogeneities. Even if the Pfr states of prototypical BV- and phycocyanobilin-binding proteins can be directly compared, these findings are not in contradiction with the present results taking into account the different time scales of NMR and RR experiments. It is very likely that the small geometry changes of the A-B and C-D methine bridges associated with the transition between the two Pfr sub-states of Agp1 (and prototypical phytochromes in general) occur on the (sub-)nanosecond time scale such that NMR signals of the two sub-states coalesce, although the separate RR bands remain unchanged. Following these arguments, it appears to be rather unlikely that the two sub-states of the Pfr state of Agp1 refer to chromophores with α- and β-facial disposition of ring D (70, 71). The interconversion between these orientations would require a rotation around the C-D methine bridge, associated with a significant activation energy and thus not compatible with transitions rates on the (sub-)nanosecond time scale.
The most striking difference in the protein-cofactor interactions may be associated with the highly conserved Asp-194 (PaBphP), which in bathy phytochromes forms a strong hydrogen bond between the carboxylate side chain and the N-H group of ring D (14). The crystal structures of prototypical phytochromes show that this side chain does not directly interact with the pyrrole N-H groups but points away from the cofactor (13). Given that this residue does not rotate upon formation of the respective Pfr state, an important factor fixing the ring D position and thus stabilizing a specific C-D methine bridge conformation is missing in prototypical phytochromes. We therefore suggest that the lack of this structural motif in prototypical phytochromes allows the tetrapyrrole to switch between two Pfr sub-states, including one sub-state that is associated with a lower activation barrier for the thermal ZZE → ZZZ isomerization for back-reaction to the Pr state.
Acknowledgment
We thank the “Norddeutscher Verbund für Hoch- und Höchstleistungsrechnen” (HLRN) for providing computer resources.
This work was supported by Deutsche Forschungsgemeinschaft Grant Sfb1078 (B5, B6, and C3).
- Pr
- red-absorbing parent states of phytochrome
- Pfr
- ar-red absorbing parent states of phytochrome
- Agp1 and Agp2
- phytochromes 1 and 2 from A. tumefaciens
- CphB
- cyanobacterial phytochrome CphB from Calothrix PCC7601
- HOOP
- hydrogen out-of-plane
- ip
- in-plane bending
- MD
- molecular dynamics
- MM
- molecular mechanics
- BV
- biliverdin
- PΦB
- phytochromobilin
- PaBphP
- bacteriophytochrome from Pseudomonas aeruginosa
- QM
- quantum mechanics
- RR
- resonance Raman
- r.m.s.d.
- root-mean-square deviation
- str
- stretching. A, B, C, and D refer to the respective pyrrole rings
- AB
- BC, and CD denote the corresponding methine bridges
- H/D
- hydrogen/deuterium exchange.
REFERENCES
- 1. Briggs W. R., Spudich J. L. (2005) Handbook of Photosensory Receptors, Wiley Verlag, Weinheim, Germany [Google Scholar]
- 2. Rockwell N. C., Lagarias J. C. (2010) A brief history of phytochromes. Chemphyschem 11, 1172–1180 [DOI] [PMC free article] [PubMed] [Google Scholar]
- 3. Kehoe D. M., Grossman A. R. (1996) Similarity of a chromatic adaptation sensor to phytochrome and ethylene receptors. Science 273, 1409–1412 [DOI] [PubMed] [Google Scholar]
- 4. Hughes J., Lamparter T., Mittmann F., Hartmann E., Gärtner W., Wilde A., Börner T. (1997) A prokaryotic phytochrome. Nature 386, 663. [DOI] [PubMed] [Google Scholar]
- 5. Wilde A., Churin Y., Schubert H., Börner T. (1997) Disruption of a Synechocystis sp. PCC 6803 gene with partial similarity to phytochrome genes alters growth under changing light qualities. FEBS Lett. 406, 89–92 [DOI] [PubMed] [Google Scholar]
- 6. Montgomery B. L., Lagarias J. C. (2002) Phytochrome ancestry: sensors of bilins and light. Trends Plant Sci. 7, 357–366 [DOI] [PubMed] [Google Scholar]
- 7. Blumenstein A., Vienken K., Tasler R., Purschwitz J., Veith D., Frankenberg-Dinkel N., Fischer R. (2005) The Aspergillus nidulans phytochrome FphA represses sexual development in red light. Curr. Biol. 15, 1833–1838 [DOI] [PubMed] [Google Scholar]
- 8. Thümmler F., Dufner M., Kreisl P., Dittrich P. (1992) Molecular cloning of a novel phytochrome gene of the moss ceratodon-purpureus which encodes a putative light-regulated protein kinase. Plant Mol. Biol. 20, 1003–1017 [DOI] [PubMed] [Google Scholar]
- 9. Yeh K. C., Wu S. H., Murphy J. T., Lagarias J. C. (1997) A cyanobacterial phytochrome two-component light sensory system. Science 277, 1505–1508 [DOI] [PubMed] [Google Scholar]
- 10. Yeh K. C., Lagarias J. C. (1998) Eukaryotic phytochromes: Light-regulated serine/threonine protein kinases with histidine kinase ancestry. Proc. Natl. Acad. Sci. U.S.A. 95, 13976–13981 [DOI] [PMC free article] [PubMed] [Google Scholar]
- 11. Lamparter T., Esteban B., Hughes J. (2001) Phytochrome Cph1 from the cyanobacterium Synechocystis PCC6803–Purification, assembly, and quaternary structure. Eur. J. Biochem. 268, 4720–4730 [DOI] [PubMed] [Google Scholar]
- 12. Hughes J. (2010) Phytochrome three-dimensional structures and functions. Biochem. Soc. Trans. 38, 710–716 [DOI] [PubMed] [Google Scholar]
- 13. Essen L. O., Mailliet J., Hughes J. (2008) The structure of a complete phytochrome sensory module in the Pr ground state. Proc. Natl. Acad. Sci. U.S.A. 105, 14709–14714 [DOI] [PMC free article] [PubMed] [Google Scholar]
- 14. Yang X., Kuk J., Moffat K. (2008) Crystal structure of Pseudomonas aeruginosa bacteriophyrochrome: Photoconversion and signal transduction. Proc. Natl. Acad. Sci. U.S.A. 105, 14715–14720 [DOI] [PMC free article] [PubMed] [Google Scholar]
- 15. Yang X., Kuk J., Moffat K. (2009) Conformational differences between the Pfr and Pr states in Pseudomonas aeruginosa bacteriophytochrome. Proc. Natl. Acad. Sci. U.S.A. 106, 15639–15644 [DOI] [PMC free article] [PubMed] [Google Scholar]
- 16. Karniol B., Vierstra R. D. (2003) The pair of bacteriophytochromes from Agrobacterium tumefaciens are histidine kinases with opposing photobiological properties. Proc. Natl. Acad. Sci. U.S.A. 100, 2807–2812 [DOI] [PMC free article] [PubMed] [Google Scholar]
- 17. Scheerer P., Michael N., Park J. H., Nagano S., Choe H. W., Inomata K., Borucki B., Krauss N., Lamparter T. (2010) Light-induced conformational changes of the chromophore and the protein in phytochromes: bacterial phytochromes as model systems. Chemphyschem 11, 1090–1105 [DOI] [PubMed] [Google Scholar]
- 18. Wagner J. R., Zhang J., Brunzelle J. S., Vierstra R. D., Forest K. T. (2007) High resolution structure of Deinococcus bacteriophytochrome yields new insights into phytochrome architecture and evolution. J. Biol. Chem. 282, 12298–12309 [DOI] [PubMed] [Google Scholar]
- 19. Rottwinkel G., Oberpichler I., Lamparter T. (2010) Bathy phytochromes in Rhizobial soil bacteria. J. Bacteriol. 192, 5124–5133 [DOI] [PMC free article] [PubMed] [Google Scholar]
- 20. Yang X., Ren Z., Kuk J., Moffat K. (2011) Temperature-scan crystallography reveals reaction intermediates in bacteriophytochrome. Nature 479, 428–432 [DOI] [PMC free article] [PubMed] [Google Scholar]
- 21. Lamparter T., Michael N., Mittmann F., Esteban B. (2002) Phytochrome from Agrobacterium tumefaciens has unusual spectral properties and reveals an N-terminal chromophore attachment site. Proc. Natl. Acad. Sci. U.S.A. 99, 11628–11633 [DOI] [PMC free article] [PubMed] [Google Scholar]
- 22. Altschul S. F., Gish W., Miller W., Myers E. W., Lipman D. J. (1990) Basic local alignment search tool. J. Mol. Biol. 215, 403–410 [DOI] [PubMed] [Google Scholar]
- 23. Mroginski M. A., von Stetten D., Escobar F. V., Strauss H. M., Kaminski S., Scheerer P., Günther M., Murgida D. H., Schmieder P., Bongards C., Gärtner W., Mailliet J., Hughes J., Essen L. O., Hildebrandt P. (2009) Chromophore structure of cyanobacterial phytochrome Cph1 in the Pr state: reconciling structural and spectroscopic data by QM/MM calculations. Biophys. J. 96, 4153–4163 [DOI] [PMC free article] [PubMed] [Google Scholar]
- 24. Yang X., Stojkovic E. A., Kuk J., Moffat K. (2007) Crystal structure of the chromophore binding domain of an unusual bacteriophytochrome, RpBphP3, reveals residues that modulate photoconversion. Proc. Natl. Acad. Sci. U.S.A. 104, 12571–12576 [DOI] [PMC free article] [PubMed] [Google Scholar]
- 25. von Stetten D., Günther M., Scheerer P., Murgida D. H., Mroginski M. A., Krauss N., Lamparter T., Zhang J., Anstrom D. M., Vierstra R. D., Forest K. T., Hildebrandt P. (2008) Chromophore heterogeneity and photoconversion in phytochrome crystals and solution studied by resonance Raman spectroscopy. Angew. Chem. Int. Ed. 47, 4753–4755 [DOI] [PubMed] [Google Scholar]
- 26. Tasler R., Moises T., Frankenberg-Dinkel N. (2005) Biochemical and spectroscopic characterization of the bacterial phytochrome of Pseudomonas aeruginosa. FEBS J. 272, 1927–1936 [DOI] [PubMed] [Google Scholar]
- 27. Inomata K., Noack S., Hammam M. A., Khawn H., Kinoshita H., Murata Y., Michael N., Scheerer P., Krauss N., Lamparter T. (2006) Assembly of synthetic locked chromophores with Agrobacterium phytochromes Agp1 and Agp2. J. Biol. Chem. 281, 28162–28173 [DOI] [PubMed] [Google Scholar]
- 28. Quest B., Hübschmann T., Sharda S., Tandeau de Marsac N., Gärtner W. (2007) Homologous expression of a bacterial phytochrome–The cyanobacterium Fremyella diplosiphon incorporates biliverdin as a genuine, functional chromophore. FEBS J. 274, 2088–2098 [DOI] [PubMed] [Google Scholar]
- 29. Borucki B., Seibeck S., Heyn M. P., Lamparter T. (2009) Characterization of the covalent and noncovalent adducts of Agp1 phytochrome assembled with biliverdin and phycocyanobilin by circular dichroism and flash photolysis. Biochemistry 48, 6305–6317 [DOI] [PubMed] [Google Scholar]
- 30. Sharda S., Shah R., Gärtner W. (2007) Domain interaction in cyanobacterial phytochromes as a prerequisite for spectral integrity. Eur. Biophys. J. 36, 815–821 [DOI] [PubMed] [Google Scholar]
- 31. Borucki B., von Stetten D., Seibeck S., Lamparter T., Michael N., Mroginski M. A., Otto H., Murgida D. H., Heyn M. P., Hildebrandt P. (2005) Light-induced proton release of phytochrome is coupled to the transient deprotonation of the tetrapyrrole chromophore. J. Biol. Chem. 280, 34358–34364 [DOI] [PubMed] [Google Scholar]
- 32. von Stetten D., Seibeck S., Michael N., Scheerer P., Mroginski M. A., Murgida D. H., Krauss N., Heyn M. P., Hildebrandt P., Borucki B., Lamparter T. (2007) Highly conserved residues Asp-197 and His-250 in Agp1 phytochrome control the proton affinity of the chromophore and Pfr formation. J. Biol. Chem. 282, 2116–2123 [DOI] [PubMed] [Google Scholar]
- 33. Manitto P., Monti D. (1980) Reaction of biliverdins with thiobarbituric acid–novel fragmentation reaction of bilin-1,19(21H,24H)-diones. J. Chem. Soc. Chem. Comm. 178–180 [Google Scholar]
- 34. Lindner I., Knipp B., Braslavsky S. E., Gärtner W., Schaffner K. (1998) A novel chromophore selectively modifies the spectral properties of one of the two stable states of the plant photoreceptor phytochrome. Angew. Chem. Int. Ed. 37, 1843–1846 [Google Scholar]
- 35. Murgida D. H., von Stetten D., Hildebrandt P., Schwinté P., Siebert F., Sharda S., Gärtner W., Mroginski M. A. (2007) The chromophore structures of the Pr states in plant and bacterial phytochromes. Biophys. J. 93, 2410–2417 [DOI] [PMC free article] [PubMed] [Google Scholar]
- 36. Buchan D. W., Ward S. M., Lobley A. E., Nugent T. C., Bryson K., Jones D. T. (2010) Protein annotation and modelling servers at University College London. Nucleic Acids Res. 38, W563–W568 [DOI] [PMC free article] [PubMed] [Google Scholar]
- 37. Jones D. T. (1999) Protein secondary structure prediction based on position-specific scoring matrices. J. Mol. Biol. 292, 195–202 [DOI] [PubMed] [Google Scholar]
- 38. Brooks B. R., Brooks C. L., MacKerell A. D., Nilsson L., Petrella R. J., Roux B., Won Y., Archontis G., Bartels C., Boresch S., Caflisch A., Caves L., Cui Q., Dinner A. R., Feig M., Fischer S., Gao J., Hodoscek M., Im W., Kuczera K., Lazaridis T., Ma J., Ovchinnikov V., Paci E., Pastor R. W., Post C. B., Pu J. Z., Schaefer M., Tidor B., Venable R. M., Woodcock H. L., Wu X., Yang W., York D. M., Karplus M. (2009) CHARMM: the biomolecular simulation program. J. Comp. Chem. 30, 1545–1614 [DOI] [PMC free article] [PubMed] [Google Scholar]
- 39. Feller S. E., Zhang Y. H., Pastor R. W., Brooks B. R. (1995) Constant-pressure molecular-dynamics simulation–the Langevin piston method. J. Chem. Phys. 103, 4613–4621 [Google Scholar]
- 40. Martyna G. J., Tobias D. J., Klein M. L. (1994) Constant-pressure molecular dynamics algorithms. J. Chem. Phys. 101, 4177–4189 [Google Scholar]
- 41. Phillips J. C., Braun R., Wang W., Gumbart J., Tajkhorshid E., Villa E., Chipot C., Skeel R. D., Kale L., Schulten K. (2005) Scalable molecular dynamics with NAMD. J. Comp. Chem. 26, 1781–1802 [DOI] [PMC free article] [PubMed] [Google Scholar]
- 42. MacKerell A. D., Jr., Bashford D., Bellott M., Dunbrack R. L., Jr., Evanseck J. D., Field M. J., Fischer S., Gao J., Guo H., Ha S., Joseph-McCarthy D., Kuchnir L., Kuczera K., Lau F. T. K., Mattos C., Michnick S., Ngo T., Nguyen D. T., Prodhom B., Reiher W. E. I., Roux B., Schlenkrich M., Smith J. C., Stote R., Straub J., Watanabe M., Wiorkiewicz-Kuczera J., Yin D., Karplus M. (1998) All-atom empirical potential for molecular modeling and dynamics studies of proteins. J. Phys. Chem. B 102, 3586–3616 [DOI] [PubMed] [Google Scholar]
- 43. Darden T., York D., Pedersen L. (1993) Particle Mesh Ewald–an N. log(N) method for Ewald sums in large systems. J. Chem. Phys. 98, 10089–10092 [Google Scholar]
- 44. Senn H. M., Thiel W. (2007) QM/MM studies of enzymes. Curr. Op. Chem. Biol. 11, 182–187 [DOI] [PubMed] [Google Scholar]
- 45. Becke A. D. (1993) Density-functional thermochemistry. 3. The role of exact exchange. J. Chem. Phys. 98, 5648–5652 [Google Scholar]
- 46. Sherwood P., de Vries A. H., Guest M. F., Schreckenbach G., Catlow C. R. A., French S. A., Sokol A. A., Bromley S. T., Thiel W., Turner A. J., Billeter S., Terstegen F., Thiel S., Kendrick J., Rogers S. C., Casci J., Watson M., King F., Karlsen E., Sjøvoll M., Fahmi A., Schäfer A., Lennartz Ch. (2003) QUASI: A general purpose implementation of the QM/MM approach and its application to problems in catalysis. J. Mol. Struct. (Theochem.) 632, 1–28 [Google Scholar]
- 47. Mroginski M. A., Mark F., Thiel W., Hildebrandt P. (2007) Quantum mechanics/molecular mechanics calculation of the Raman spectra of the phycocyanobilin chromophore in α-c-phycocyanin. Biophys. J. 93, 1885–1894 [DOI] [PMC free article] [PubMed] [Google Scholar]
- 48. Mroginski M. A., Kaminski S., von Stetten D., Ringsdorf S., Gärtner W., Essen L. O., Hildebrandt P. (2011) Structure of the chromophore binding pocket in the Pr state of plant phytochrome phyA. J. Phys. Chem. B 115, 1220–1231 [DOI] [PubMed] [Google Scholar]
- 49. Mroginski M. A., Kaminski S., Hildebrandt P. (2010) Raman spectra of the phycoviolobilin cofactor in phycoerythrocyanin calculated by QM/MM. Chemphyschem 11, 1265–1274 [DOI] [PubMed] [Google Scholar]
- 50. Hildebrandt P., Hoffmann A., Lindemann P., Heibel G., Braslavsky S. E., Schaffner K., Schrader B. (1992) Fourier-transform resonance Raman-spectroscopy of phytochrome. Biochem. 31, 7957–7962 [DOI] [PubMed] [Google Scholar]
- 51. Fodor S. P. A., Lagarias J. C., Mathies R. A. (1990) Resonance Raman analysis of the Pr and Pfr forms of phytochrome. Biochem. 29, 11141–11146 [DOI] [PubMed] [Google Scholar]
- 52. Schwede T., Kopp J., Guex N., Peitsch M. C. (2003) SWISS-MODEL: an automated protein homology-modeling server. Nucleic Acids Res. 31, 3381–3385 [DOI] [PMC free article] [PubMed] [Google Scholar]
- 53. Buckler D. R., Zhou Y., Stock A. M. (2002) Evidence of intradomain and interdomain flexibility in an OmpR/PhoB homolog from Thermotoga maritima. Structure 10, 153–164 [DOI] [PubMed] [Google Scholar]
- 54. Brunger A. T., Adams P. D., Clore G. M., Delano W. L., Gros P., Grosse-Kunstleve R. W., Jiang J. S., Kuszewski J., Nilges M., Pannu N. S., Read R. J., Rice L. M., Simonson T., Warren G. L. (1998) Crystallography and NMR system: A new software suite for macromolecular structure determination. Acta Cryst. D 54, 905–921 [DOI] [PubMed] [Google Scholar]
- 55. Laskowski R. A., Macarthur M. W., Moss D. S., Thornton J. M. (1993) Procheck–a program to check the stereochemical quality of protein structures. J. Appl. Crystallogr. 26, 283–291 [Google Scholar]
- 56. Hooft R. W., Vriend G., Sander C., Abola E. E. (1996) Errors in protein structures. Nature 381, 272. [DOI] [PubMed] [Google Scholar]
- 57. Emsley P., Lohkamp B., Scott W. G., Cowtan K. (2010) Features and development of Coot. Acta Crystallogr. Sect. D Biol. Crystallogr. 66, 486–501 [DOI] [PMC free article] [PubMed] [Google Scholar]
- 58. Kneip C., Hildebrandt P., Schlamann W., Braslavsky S. E., Mark F., Schaffner K. (1999) Protonation state and structural changes of the tetrapyrrole chromophore during the Pr → Pfr phototransformation of phytochrome. A resonance Raman spectroscopic study. Biochemistry 38, 15185–15192 [DOI] [PubMed] [Google Scholar]
- 59. Mroginski M. A., von Stetten D., Kaminski S., Velazquez Escobar F., Michael N., Daminelli-Widany G., Hildebrandt P. (2011) Elucidating photoinduced structural changes in phytochromes by the combined application of resonance Raman spectroscopy and theoretical methods. J. Mol. Struct. 993, 15–25 [Google Scholar]
- 60. Rice J. A. (2007) Mathematical Statistics and Data Analysis, 3 Ed., Thomson Books/Cole, Duxbury Press, Pacific Grove, CA [Google Scholar]
- 61. Schwinté P., Foerstendorf H., Hussain Z., Gärtner W., Mroginski M. A., Hildebrandt P., Siebert F. (2008) FTIR study of the photoinduced processes of plant phytochrome phyA using isotope-labeled bilins and density functional theory calculations. Biophys. J. 95, 1256–1267 [DOI] [PMC free article] [PubMed] [Google Scholar]
- 62. Wagner J. R., Zhang J., von Stetten D., Günther M., Murgida D. H., Mroginski M. A., Walker J. M., Forest K. T., Hildebrandt P., Vierstra R. D. (2008) Mutational analysis of Deinococcus radiodurans bacteriophytochrome reveals key amino acids necessary for the photochromicity and proton exchange cycle of phytochromes. J. Biol. Chem. 283, 12212–12226 [DOI] [PMC free article] [PubMed] [Google Scholar]
- 63. Brandt S., von Stetten D., Günther M., Hildebrandt P., Frankenberg-Dinkel N. (2008) The fungal phytochrome FphA from Aspergillus nidulans. J. Biol. Chem. 283, 34605–34614 [DOI] [PMC free article] [PubMed] [Google Scholar]
- 64. Song C., Essen L. O., Gärtner W., Hughes J., Matysik J. (2012) Solid-state NMR spectroscopic study of chromophore-protein interactions in the Pr ground state of plant phytochrome A. Mol. Plant 5, 698–715 [DOI] [PubMed] [Google Scholar]
- 65. Song C., Rohmer T., Tiersch M., Zaanen J., Hughes J., Matysik J. (2013) Solid state NMR spectroscopy to probe photoactivation in canonical phytochromes. Photochem. Photobiol. 89, 259–273 [DOI] [PubMed] [Google Scholar]
- 66. Freer L., Kim P. W., Corley S. C., Rockwell N. C., Zhao L., Thibert A. J., Lagarias J. C., Larsen D. S. (2012) Chemical inhomogeneity in the ultrafast dynamics of the DXCF cyanobacteriochrome Tlr0924. J. Phys. B, 116, 10571–10581 [DOI] [PubMed] [Google Scholar]
- 67. Chen Y., Zhang J., Luo J., Tu J. M., Zeng X. L., Xie J., Zhou M., Zhao J. Q., Scheer H., Zhao K. H. (2012) Photophysical diversity of two novel cyanobacteriochromes with phycocyanobilin chromophores: photochemistry and dark reversion kinetics. FEBS J. 279, 40–54 [DOI] [PubMed] [Google Scholar]
- 68. Schmidt P., Gensch T., Remberg A., Gärtner W., Braslavsky S. E., Schaffner K. (1998) The complexity of the Pr to Pfr phototransformation kinetics is an intrinsic property of native phytochrome. Photochem. Photobiol. 68, 754–761 [Google Scholar]
- 69. Kim P. W., Freer L. H., Rockwell N. C., Martin S. S., Lagarias J. C., Larsen D. S. (2012) Femtosecond photodynamics of the red/green cyanobacteriochrome NpR6012g4 from Nostoc punctiforme. 2. reverse dynamics. Biochemistry 51, 619–630 [DOI] [PubMed] [Google Scholar]
- 70. Rockwell N. C., Shang L., Martin S. S., Lagarias J. C. (2009) Distinct classes of red/far-red photochemistry within the phytochrome superfamily. Proc. Natl. Acad. Sci. U.S.A. 106, 6123–6127 [DOI] [PMC free article] [PubMed] [Google Scholar]
- 71. Song C., Psakis G., Lang C., Mailliet J., Gärtner W., Hughes J., Matysik J. (2011) Two ground state isoforms and a chromophore D-ring photoflip triggering extensive intramolecular changes in a canonical phytochrome. Proc. Natl. Acad. Sci. U.S.A. 108, 3842–3847 [DOI] [PMC free article] [PubMed] [Google Scholar]


