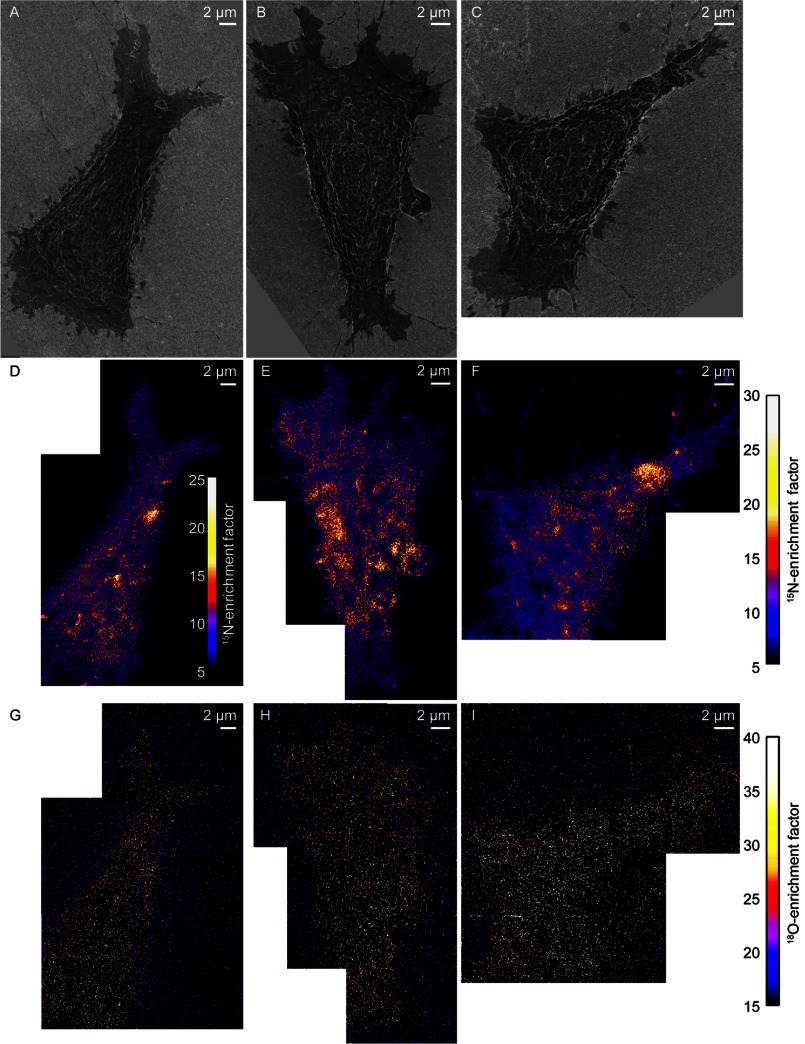
FIGURE 3.
SEM and SIMS images of cells that were treated with mβCD to reduce cellular cholesterol levels by 30%. A–C, SEM images show the morphology of three metabolically labeled clone 15 cells that were treated with mβCD to reduce their cellular cholesterol levels. D–F, mosaics of 15N-enrichment SIMS images show mβCD treatment reduced the number of 15N-sphingolipid domains (orange, yellow, and white areas) in the plasma membranes of the clone 15 cells. The false color scale that quantifies the 15N-enrichment at each pixel is shown in the inset in D, and at the right side of the figure for E and F. G–I, mosaics of 18O-enrichment SIMS images of the clone 15 cells show the remaining 18O-cholesterol in the plasma membrane of each cell appeared to be relatively evenly distributed. Images of B, C, E, and F were adapted from Ref. 11.

