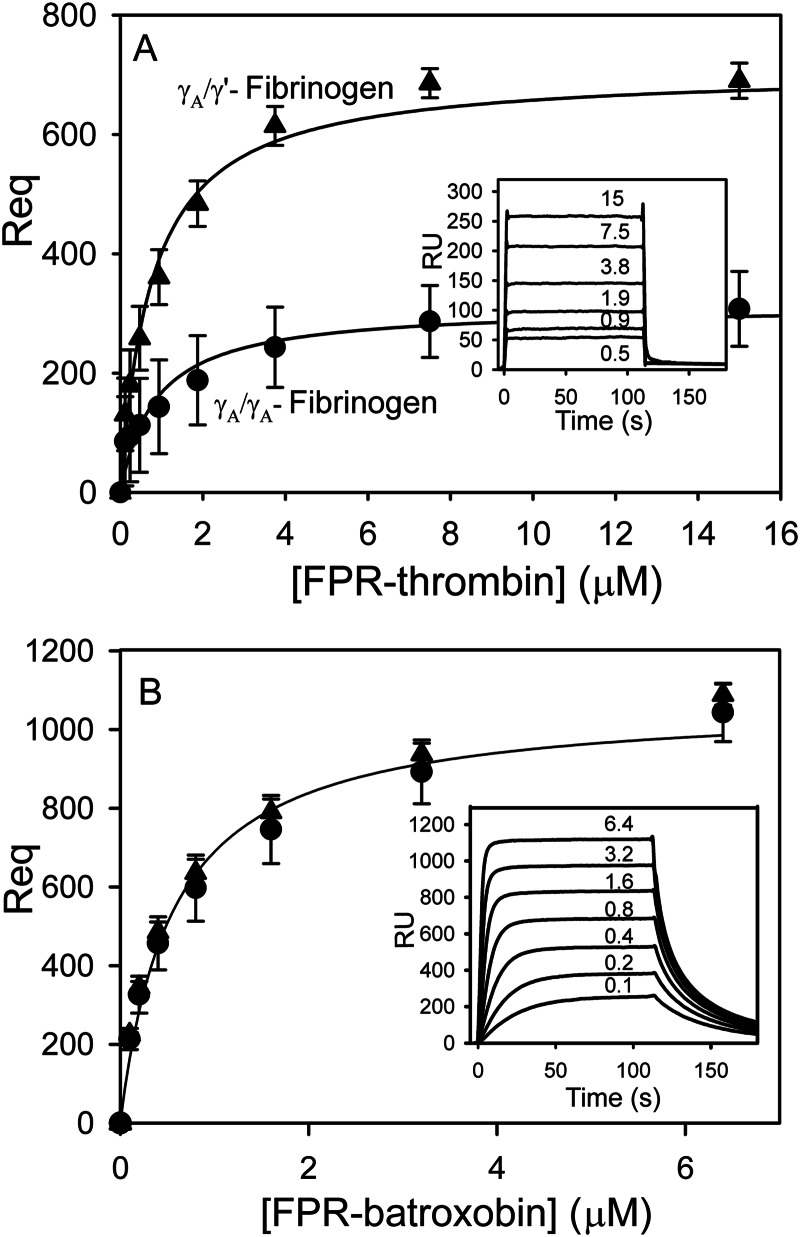
FIGURE 2.
SPR analysis of the interaction of FPR-batroxobin and FPR-thrombin with immobilized γA/γA- or γA/γ′-fibrinogen. γA/γA- (●) and γA/γ′-fibrinogen (▴) were adsorbed on individual flow cells to ∼6000–8000 RU. Increasing concentrations (0–15 μm) of FPR-thrombin (A) or FPR-batroxobin (B) were successively injected into flow cells for 2 min, followed by a 4-min wash to monitor dissociation. The amount of protease bound at equilibrium (Req) after background correction is plotted against the input FPR-protease concentration. The insets show representative sensorgrams for the interaction of FPR-thrombin (A) and FPR-batroxobin (B) with γA/γA-fibrinogen in concentrations up to 15 and 6.4 μm, respectively. Data points represent the mean ± S.D. of 2- 3 experiments, and the lines represent nonlinear regression analyses.

