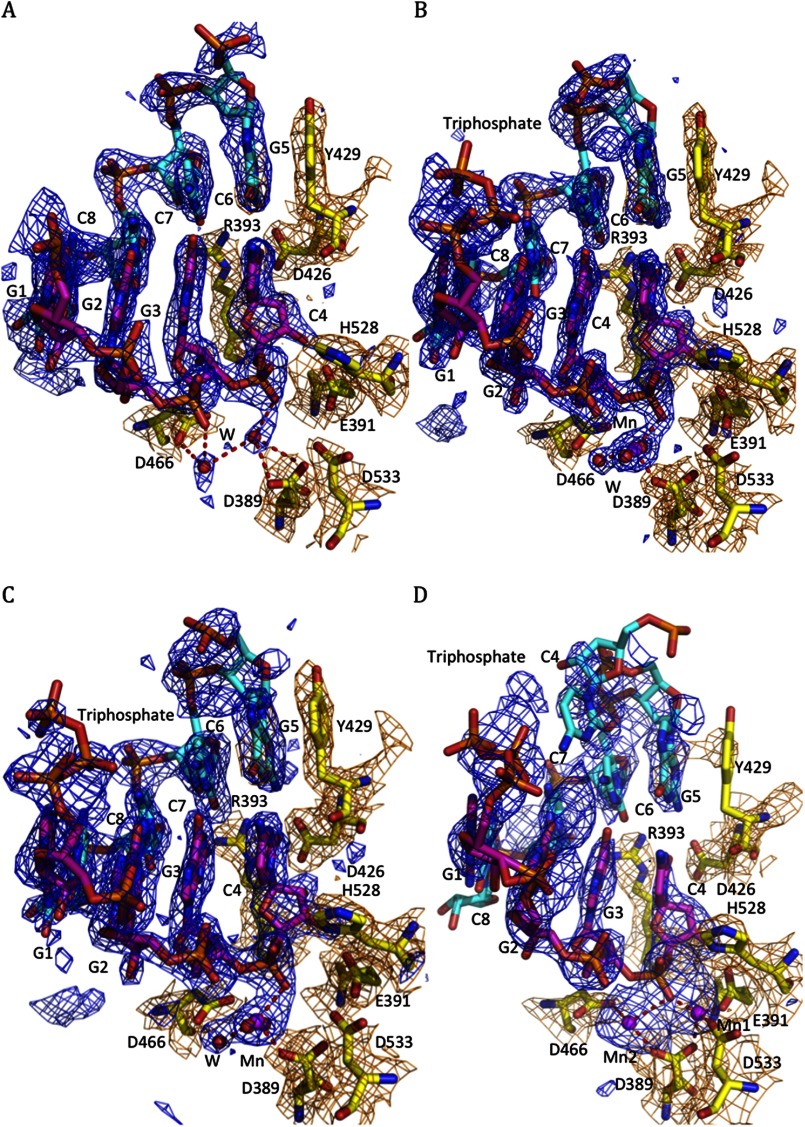
FIGURE 6.
Time course structural analysis of LASV NP-C·dsRNA complex soaked in Mn2+ solution. Fo − Fc electron density map of the 5′-ppp dsRNA is shown in blue contoured at 2.5 σ, and the 2Fo − Fc electron density map of the active site residues are shown in orange contoured at 1 σ. A, only water molecules, but not Mn2+, are present in the active site prior to the soaking. B, after soaking in Mn2+ solution for 1 min, one Mn2+ was identified and was coordinated by three water molecules, side chain (OD1) of Asp-389 and two phosphoryl oxygen molecules (O1P and O3*) of the dsRNA substrate (supplemental Fig. S4). The electron density for the 5′-ppp moiety (triphosphate) of the cleaving could be detected. C, after soaking for 1.5 min, only one Mn2+ ion can be seen with three coordinating water molecules. D, after soaking in Mn2+ solution for 5 min, the electron density of the 1st Mn2+ appeared, and the electron density of the side chain of Tyr-429 disappeared, whereas other local residues did not change, suggesting that Tyr-429 became structurally disordered.

