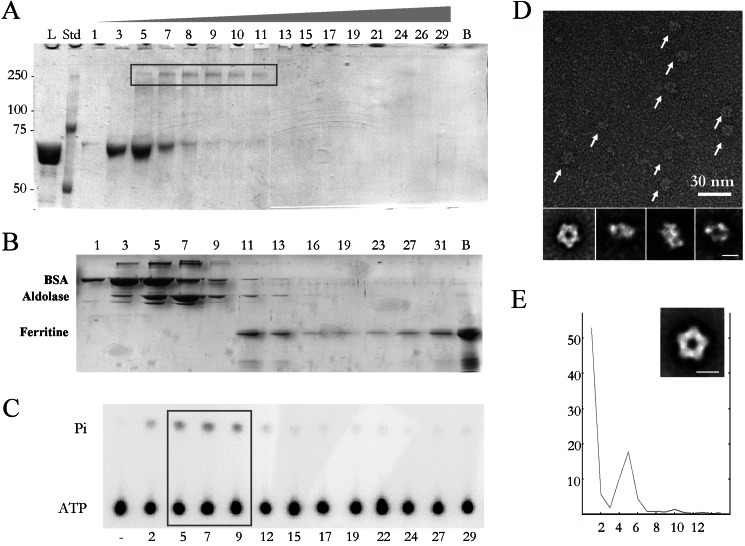
FIGURE 1.
Purification of the oligomeric active terminase and EM analysis. A, SDS-polyacrylamide gel electrophoresis of the fractions from a GraFix centrifugation show the presence of the gp19 monomer (fractions 3–8) and oligomer (box, fractions 5–11). Bands were detected by staining with Coomassie Brilliant Blue. L, load; Std, protein standards; lane B, bottom of the centrifuge tube. B, shown is SDS-polyacrylamide gel electrophoresis of the fractions from a gradient centrifugation of a mixture of molecular mass markers: bovine serum albumin (66 kDa, peak in fraction 3–5), aldolase (158 kDa, peak in fraction 5–9) and ferritin (440 kDa, peak in fraction 11–13). Lane B, bottom of the centrifuge tube. C, shown is measurement of the gp19 ATPase activity. ATPase assays were tested in duplicate; − represents buffer control. The concentration of gp19 tested in each assay was 0.45 μm. The box highlights the active oligomeric fractions from 5 to 9. Pi represents inorganic phosphate. D shows a negatively stained sample of a field of purified large terminases (arrows). Lower row, two-dimensional averaged images of the oligomeric terminase. E, rotational analysis of the harmonic components (x axis) of the end-on averaged image of the terminase shows the existence of 5-fold symmetry (percentage of total rotational power in the y axis). Inset, averaged image with imposed pentameric symmetry. The scale bar represents 100 Å.

