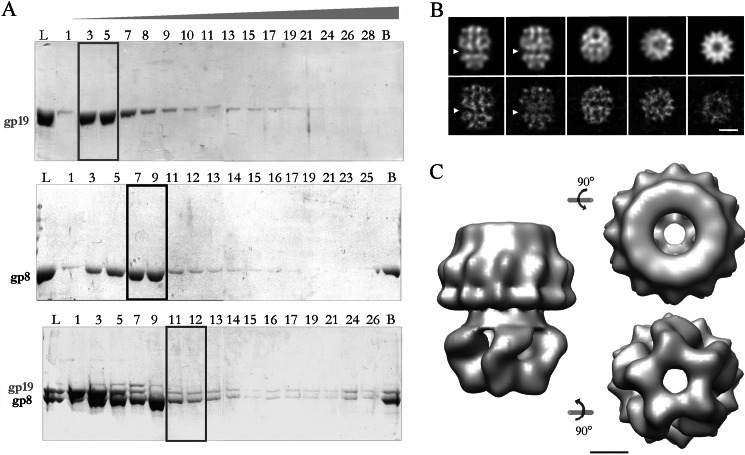
FIGURE 3.
Purification and characterization of the connector-terminase complex. A, shown is an electrophoretic analysis of the fractions from glycerol gradient centrifugation of purified terminase (upper panel), connector (middle panel), and connector-terminase complex (lower panel). L, load; B, bottom of the gradient. The gp19 monomer was concentrated in fractions 3–5 (box), the peak of oligomeric connectors corresponded to fractions 7–9 (box), and an estequiometric proportion of both oligomeric proteins was observed in fractions 11–12 of the lower panel gradient (box), suggesting the existence of a putative complex. B, shown are projection images from the three-dimensional reconstructed model (upper row) and averaged views from the experimental images (lower row). The arrowhead points the proposed interface between the terminase and the connector assemblies. The scale bar corresponds to 100 Å. C, side, end-on, and bottom views of the three-dimensional reconstruction of the complex show the two morphologically different domains. The longitudinal axis of the complex is 220 Å, and the maximum diameter is 190 Å. The scale bar represents 50 Å.

