FIGURE 4.
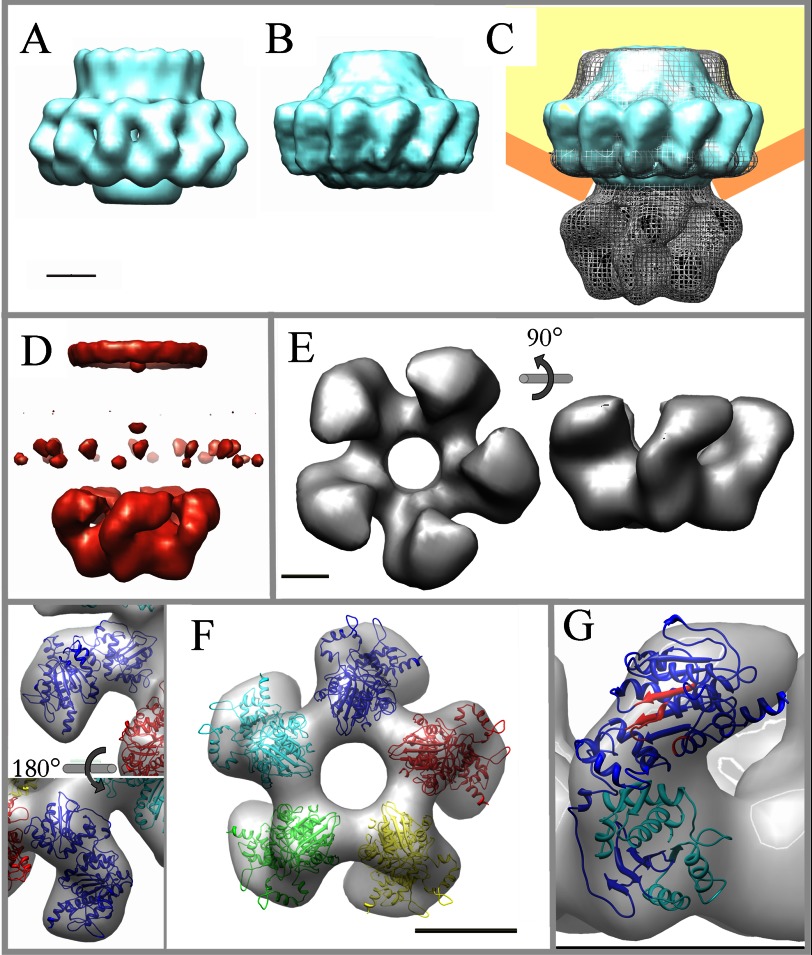
Topology of the connector-terminase complex and docking of the gp19 atomic model. A, shown is filtered reconstruction of the cryo-EM model of the T7 connector. B, shown is three-dimensional reconstruction of the connector by negative staining. C, the three-dimensional volume of the connector (in cyan) fits well in the upper domain of the connector-terminase complex (in gray mesh). A schematic of the position of the complex in the procapsid is also included (in orange and yellow). D, shown is difference volume (in red) between the complex and the connector; besides some minor differences in the crown and wings of the connector, the main difference volume corresponds to the lower domain of the complex, which has been assigned to the terminase. E, shown is a surface representation of the pentameric terminase segmented from the connector-terminase complex in two different orientations, as indicated. F, shown is fit of the gp19 atomic model into the segmented volume of the terminase complexed with the connector. Two detailed views of monomer docking are shown in distinct orientations as indicated (left) and the docking of the pentameric atomic model in end-on view (right). G, location of the catalytic regions of the terminase structure in the connector-bound conformation is shown. ATPase motifs are shown in red, and the nuclease region is in cyan. The scale bars represent 50 Å.

