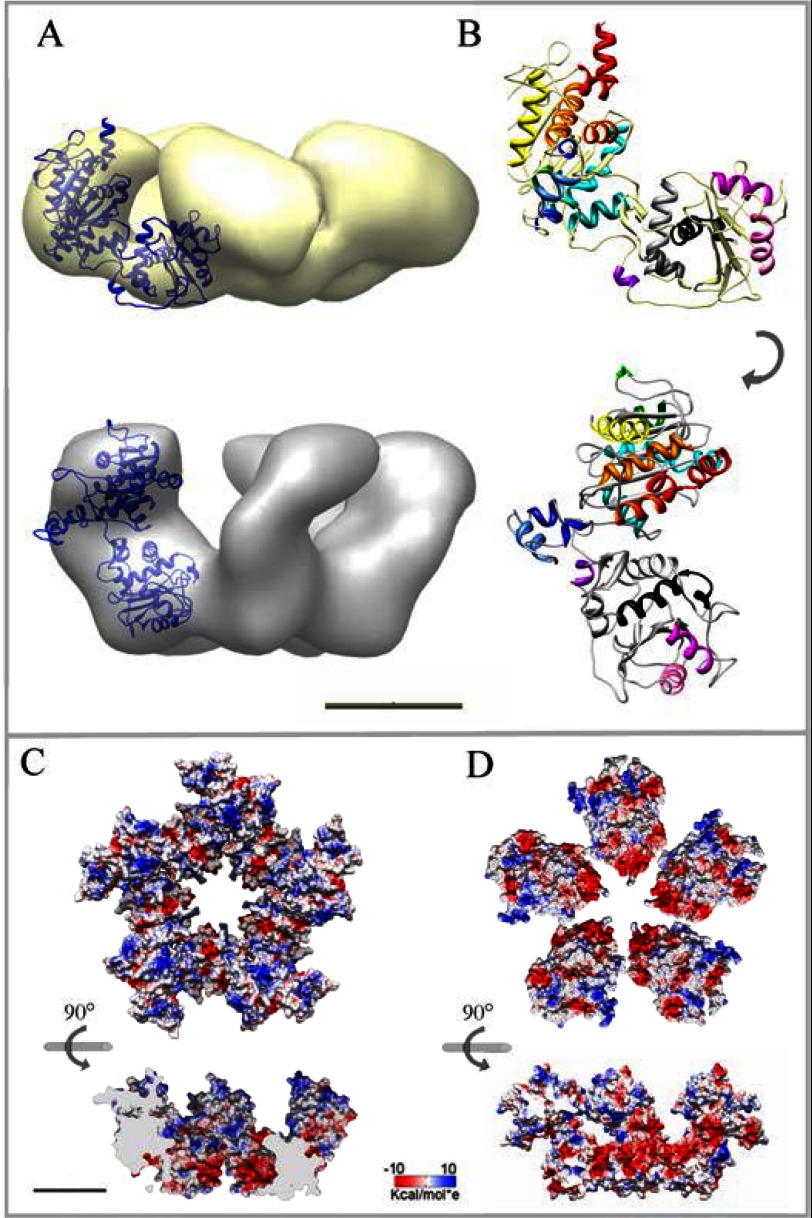
FIGURE 5.
Two distinct conformations of the terminase pentamer; isolated terminase and complexed after interaction with the connector. A, shown is fit of the gp19 monomer atomic model into the EM envelopes of the isolated (yellow) and complex-segmented terminase (gray). B, shown is rigid body transition of the gp19 monomer atomic model from the isolated (upper site) to the complex conformation (lower site). Each helix is depicted in a different color to highlight the global movement and the absence of intramolecular bending. C, shown is electrostatic potential of the isolated terminase surface in end-on view (amino domain up) and side section of the internal channel (lower panel). D, surface potential of the complex-segmented terminase in an equivalent end-on view (upper panel) and cross-section of the internal channel (lower panel) are shown. The scale bar represents 50 Å.

