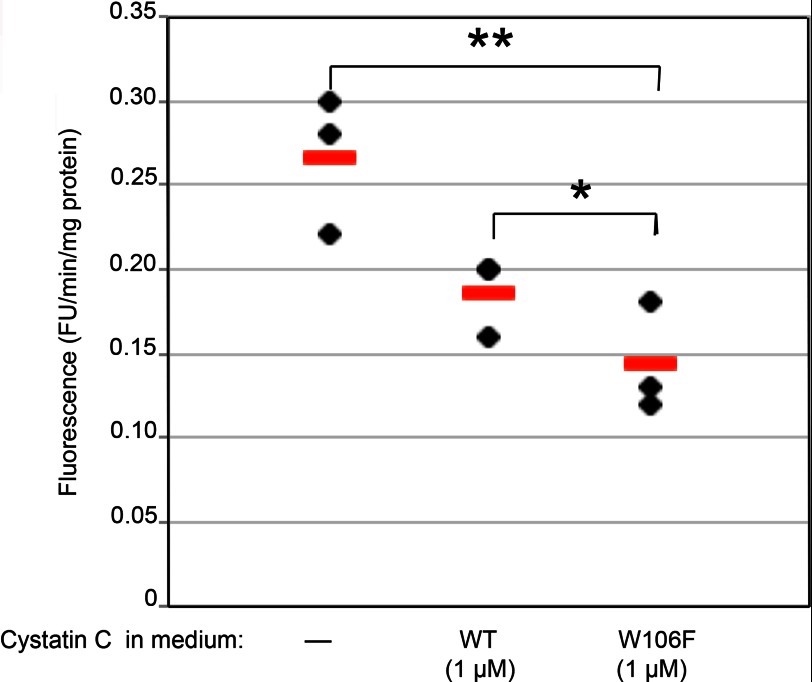
FIGURE 7.
Regulation of intracellular legumain. Cells were seeded in 96-well plates and incubated in standard medium or medium with addition of either 1 μm wild-type cystatin C or W106F-cystatin C. After cell lysis a fluorescent substrate for legumain (Z-Ala-Ala-Asn-NMec) was added. The increase in fluorescence per minute was correlated to the total protein content in each sample. Closed symbols represent mean values of triplicate wells in one experiment, and bars represent median values. The non-parametric Mann-Whitney U test was used to compare the groups.

