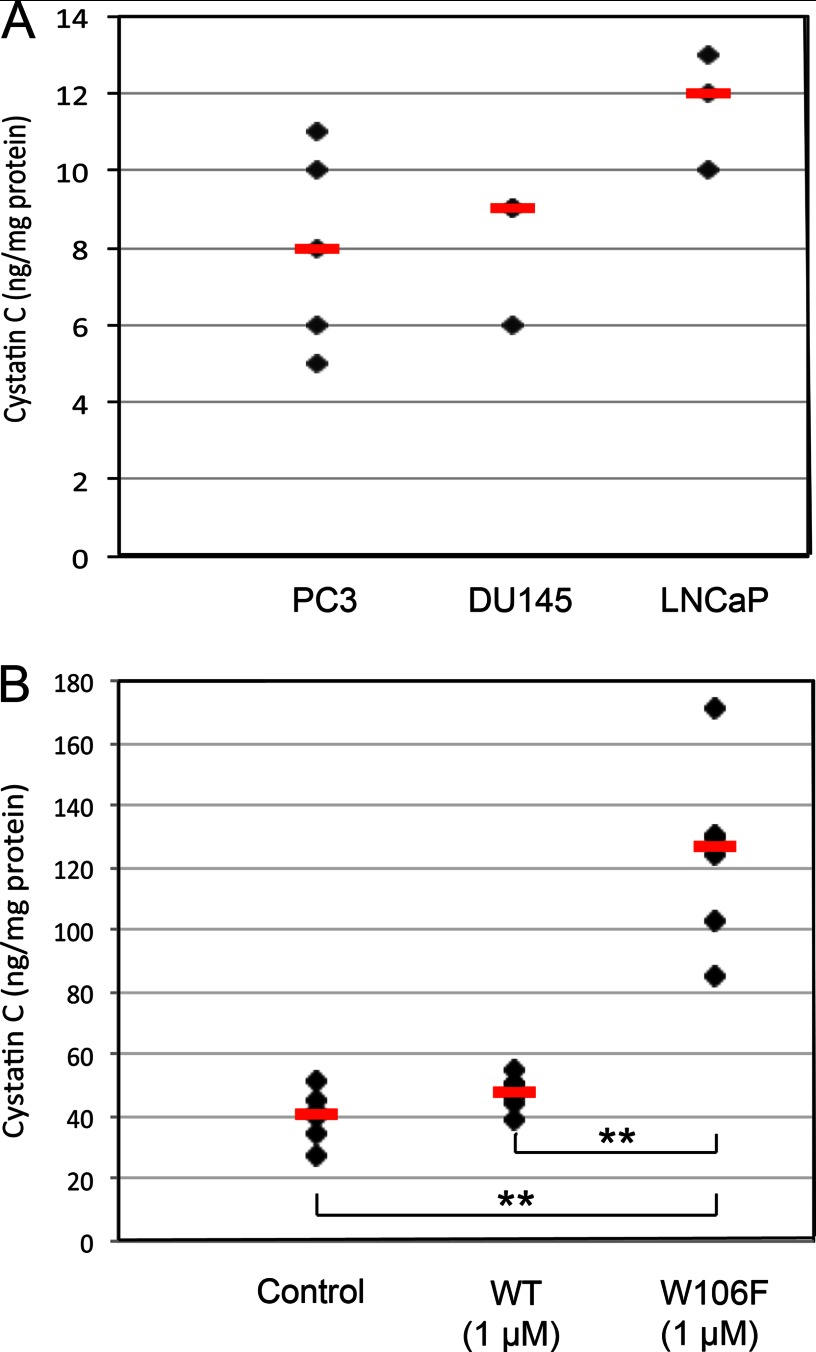
FIGURE 8.
Cystatin C uptake in prostate cancer cell lines. A, PC3, DU145, and LNCaP cells were incubated with 1 μm biotinylated cystatin C for 24 h. The biotinylated cystatin C content of cell lysates was measured by ELISA and correlated to total protein levels. B, cells were incubated for 6 h with 1 μm unlabeled wild-type or W106F-cystatin C. The total cystatin C content in lysates was measured by ELISA and correlated to the total protein content. Black symbols represent mean values of triplicate wells in a single experiment. Red bars represent median values (n = 3–6). The non-parametric Mann-Whitney U test was used to compare groups.

