
FIGURE 2.
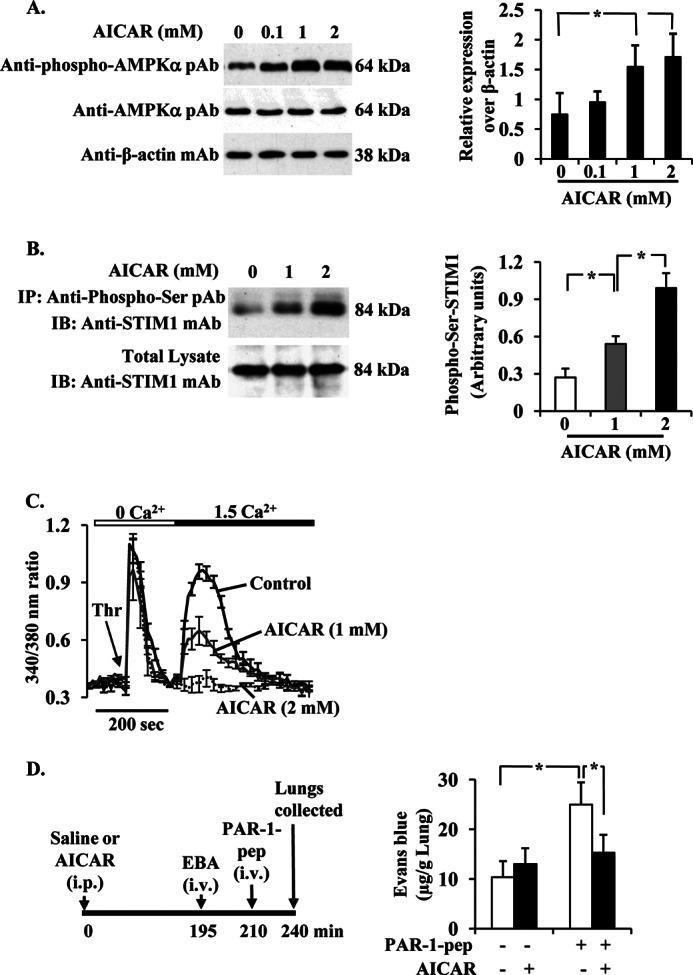
AMPK activation abrogates PAR-1-induced Ca2+ entry in ECs and lung microvessel permeability. A, AICAR induces phosphorylation of AMPKα. HLMVECs grown to 80% confluence were pretreated with AICAR (0, 0.1, 1, and 2 mm) for 2 h in 1% serum-containing medium. Cells were then lysed and immunoblotted with anti-phospho-AMPKα mAb (top), anti-AMPKα pAb (middle), and anti-β-actin mAb. A representative blot is shown from four independent experiments. The protein bands were quantified by densitometry relative to β-actin (right panel). *, significantly different from cells not treated with AICAR. B, AICAR induces STIM1 phosphorylation. HLMVECs exposed to the indicated concentrations of AICAR for 2 h as above. Cells were lysed; lysates were immunoprecipitated (IP) with anti-phospho-Ser pAb, and then the precipitate was immunoblotted (IB) with anti-STIM1 mAb. Results shown are from representative of four experiments. The quantified results are shown in the right panel. *, significantly different from control. C, AICAR inhibits thrombin-induced Ca2+ entry. HLMVECs grown on coverslips and pretreated with AICAR (1 or 2 mm) for 2 h were used to measure Ca2+ entry. Fura-2-loaded cells placed in Ca2+- and Mg2+-free HBSS were stimulated with thrombin (50 nm). After return of [Ca2+]i to base-line levels, CaCl2 (1.5 mm) was added to extracellular medium to induce Ca2+ entry. Arrow indicates time at which cells were stimulated with thrombin (Thr). Results shown are mean ± S.E. of four experiments. D, AICAR pretreatment abrogates PAR-1-induced lung vascular permeability increase. C57BL/6 mice either injected with AICAR (500 mg/kg, intraperitoneally) or saline were used to measure PAR-1-peptide-induced EBA uptake in lungs. Top panel shows experimental design. Results are mean ± S.E. of changes in lung EBA after PAR-1 agonist peptide administration (n = 6; in each group). * indicates the significance between the treatment groups and the respective control groups (p < 0.05).