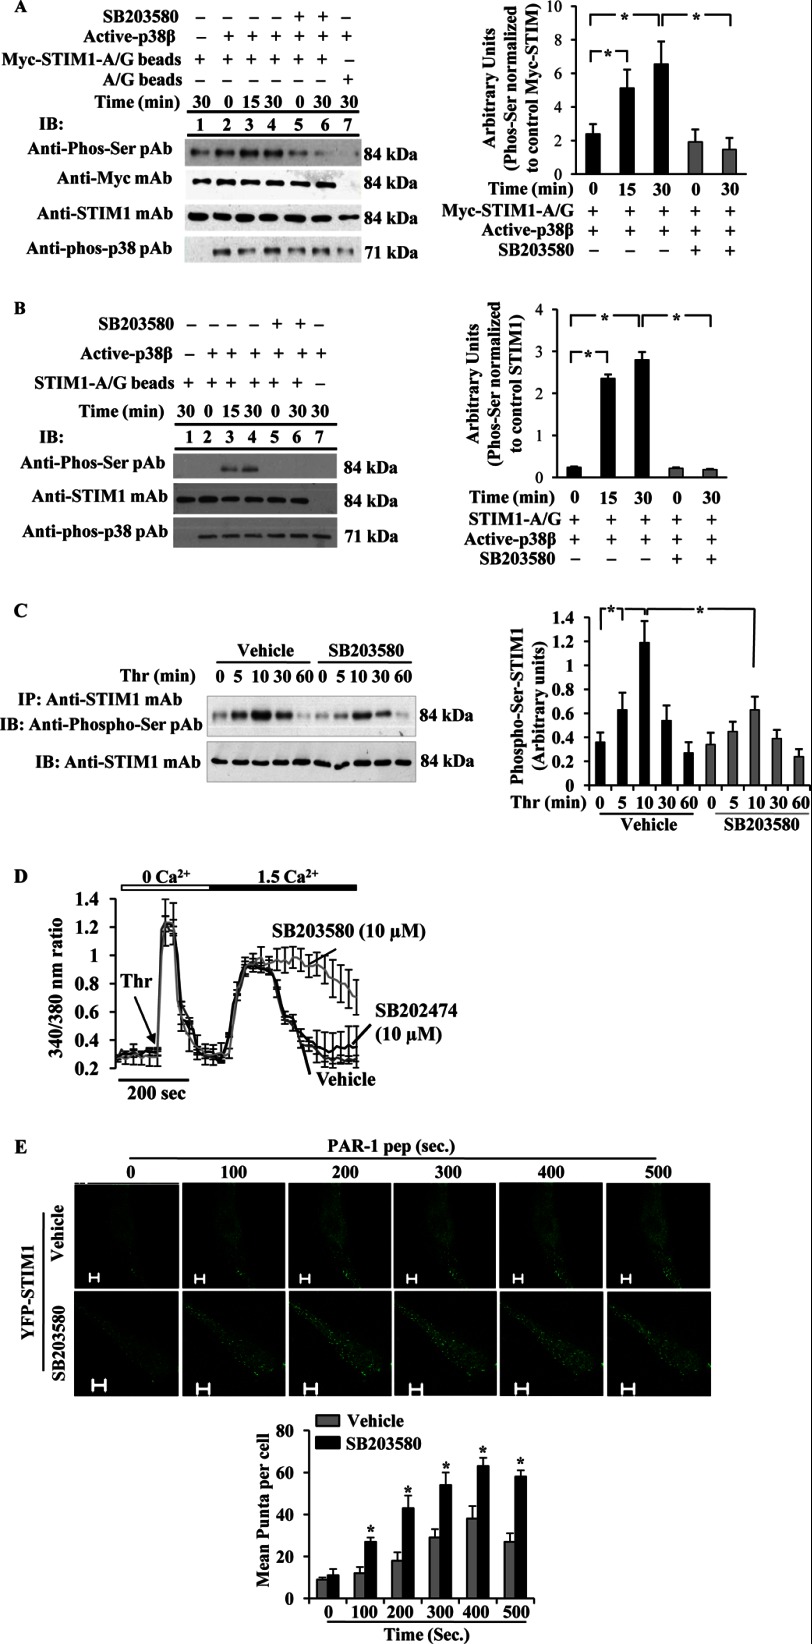
FIGURE 4.
p38 MAPK downstream of AMPK signaling controls SOCE via phosphorylation of STIM1. A and B, phosphorylation of STIM1 by active p38β2 was determined using in vitro kinase assay (see details under “Experimental Procedures”). A, Myc-STIM1 was ectopically expressed in HEK293 cells and immunoprecipitated (IP) using anti-Myc; mAb was used as substrate for active p38β2. The assay was performed in the presence (+) and absence (−) of p38 inhibitor, SB203580 (10 μm). Lane 1, active p38β2 was not included in the kinase mixture; lane 7, control A/G beads were incubated with Myc-STIM1 expressing HEK cell lysates included in the kinase assay mixture loaded. Equal volume of assay mixture was immunoblotted (IB) with anti-phospho-Ser pAb, anti-Myc pAb, anti-STIM1 mAb, or anti-phospho-p38 pAb (left panel). Phosphoprotein bands were quantified by densitometry and expressed as relative to Myc-STIM1 (right panel). Results shown are mean ± S.E. of three independent experiments. *, significantly different from SB203580 treatment. B, unstimulated HLMVECs were immunoprecipitated using anti-STIM1 pAb, and the immunoprecipitate was used as substrate for active p38β2. The assay was performed as above. Equal volume of assay mixture was immunoblotted with anti-phospho-Ser pAb, anti-STIM1 mAb, or anti-phospho-p38 pAb (left panel). Results shown are mean ± S.E. of four independent experiments (right panel). *, significantly different from SB203580 treatment. Note that active p38β2-mediated STIM1 phosphorylation was detectable by anti-phospho-Ser pAb. C, HLMVECs pretreated with vehicle (DMSO, 0.01%) or SB203580 (10 μm) for 30 min were used to measure thrombin-induced phosphorylation of STIM1 as above in Fig. 1A. Phosphoprotein bands were quantified by densitometry and expressed as relative to control (right panel). Results shown are mean ± S.E. of three experiments. *, significantly different from cells not stimulated with thrombin or significant difference between control and SB203580-treated cells. D, HLMVECs pretreated with SB203580 (10 μm) or SB202474 (10 μm) were used to measure thrombin-induced Ca2+ entry as described above. Arrow indicates time of addition of thrombin (Thr). Results shown are mean ± S.E. of four independent experiments. E, HLMVECs grown to ∼70% confluence on glass-bottomed 35-mm dishes were transfected with YFP-WT-STIM1 expression construct. At 48 h after transfection, cells pretreated with SB203580 (10 μm) for 30 min were washed and placed in HBSS, and then PAR-1 peptide-induced STIM1 puncta formation was monitored in real time using a confocal microscope. STIM1 puncta were seen both in vehicle or SB203580-pretreated cells, whereas an increase or sustained puncta formation was observed in SB203580-treated cells. The images acquired from representative experiments are shown (top panels). STIM1 puncta formed after PAR-1 peptide addition was quantified, and results shown are mean ± S.E. (bottom panel). n = 4 from each group; *, significantly different from vehicle.

