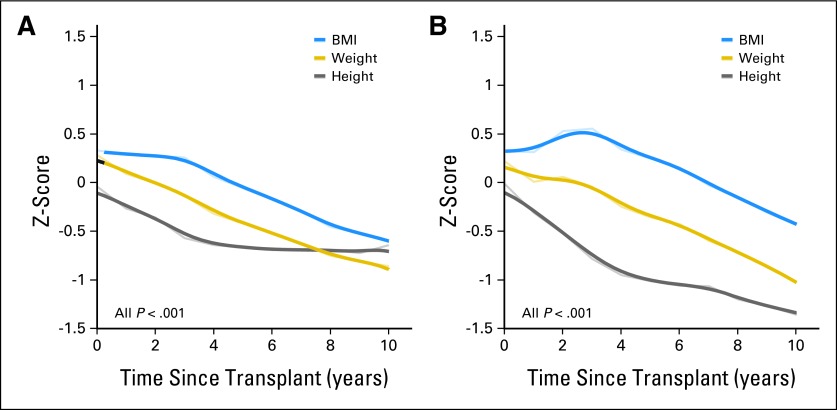
Fig 2.
Longitudinal changes in mean body mass index (BMI), weight, and height z scores in (A) all survivors (n = 179) and (B) in those younger than 12 years old at the time of hematopoietic stem-cell transplantation (n = 95). Narrow lines connect the observed mean z scores, whereas corresponding broader lines represent the statistically smoothed curves.

