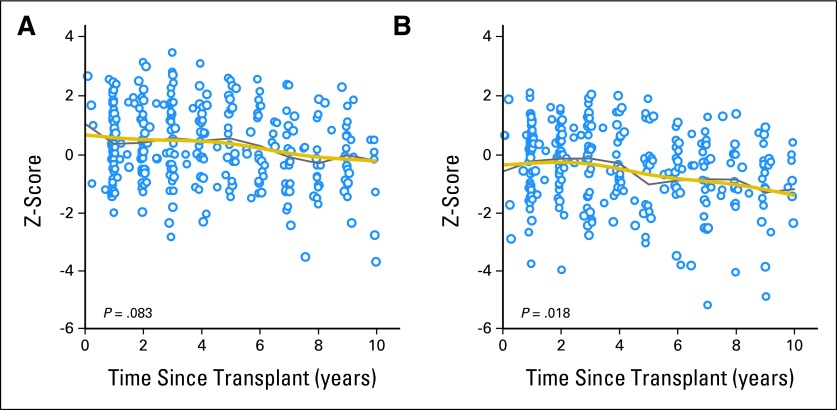
Fig 3.
Scatter plot showing longitudinal changes in z scores for (A) total body fat percentage and (B) lean mass/height2 after hematopoietic stem-cell transplantation. Data points represent 324 dual energy x-ray absorptiometry scans in 134 patients. Gray lines connect the observed mean z scores, whereas gold lines represent the statistically smoothed curves.

