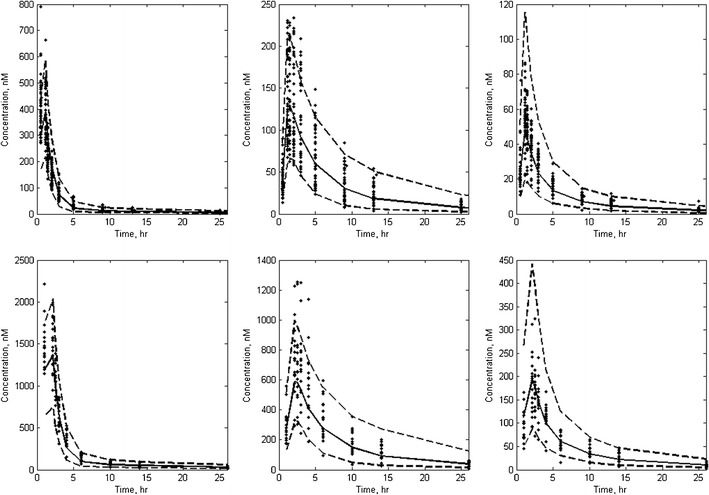
Fig. 4.

Visual predictive check for rolofylline (left-most panels), M1-trans (center panels) and M1-cis (right-most panels). Concentration profiles corresponding to 1 and 2 h infusion times were dose-normalized to the 10- and 50-mg dose levels, respectively, and depicted on the top and bottom panels, respectively. Observed data are indicated as points; the solid and dashed lines represent median and both 10% and 90% intervals of the model-predicted concentrations. For clarity, only data up to 25 h post-start of infusion are depicted in this representation
