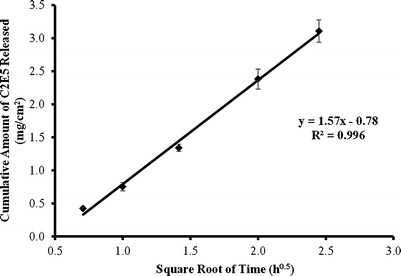
Fig. 3.

Relationship between square root of time and cumulative amount of C2E5 released through a cellulose membrane into 0.1 M phosphate buffer after application of C2E5 nonaqueous gel (n = 5). The C2E5 nonaqueous gel consisted of 20% EC10, 40% C2E5, and 40% Miglyol 840. The release rate constant k is determined from the slope of the cumulative amount of C2E5 released per unit membrane area from the tested nonaqueous gel versus square root of time defined in Eq. 4
