
Fig. 1.
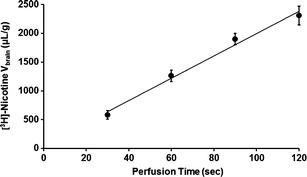
Time course of [3H]-nicotine transport by the Swiss mouse brain (solid line) expressed as apparent distribution volume (V brain, in microliters per gram), determined by in situ brain perfusion for 30, 60, 90, and 120 s. This line indicates a linear regression with r 2 = 0.988. Data represent the means ± SD of four to five animals