
Fig. 2.
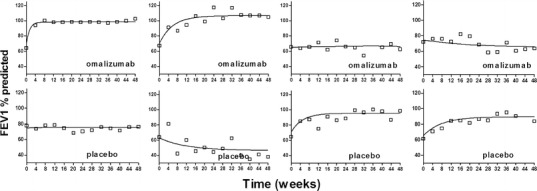
Comparison of observed and individual predicted FEV1 percent predicted responses for typical subjects in omalizumab (upper panels) and placebo (lower panels) groups. Open squares are the observed FEV1 percent predicted. Solid lines are the individual model predictions