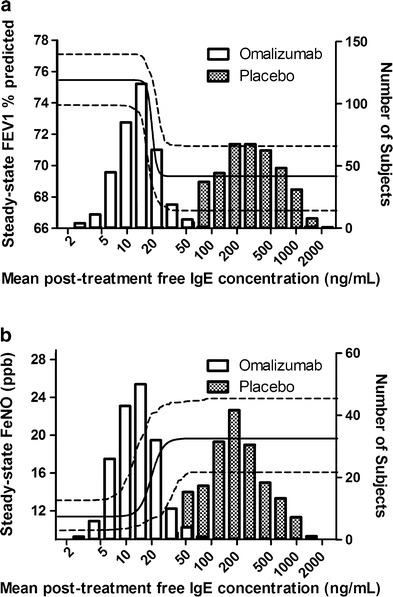
Fig. 5.

Model-predicted relationships between serum free IgE level and steady-state FEV1 percent predicted (a) and serum free IgE level and steady-state FeNO (b). Solid curves are the mean predictions and areas between two dashed curves are the 90% confidence intervals. The histograms illustrate the mean observed posttreatment serum free IgE distributions in the omalizumab and placebo groups
