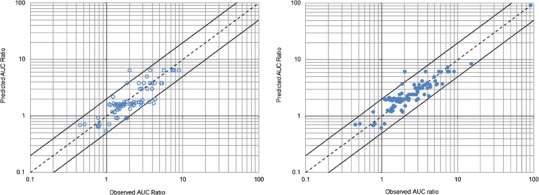
Fig. 1.

Observed area under the time–concentration curve (AUC) ratios versus genotype-based predictions from the external validation (left panel, open circles) and final estimation (right panel, filled circles) steps. The dashed line is the line of identity (y = x). The upper and lower solid lines represent y = 2x and y = 0.5x, respectively
