
Figure 3.
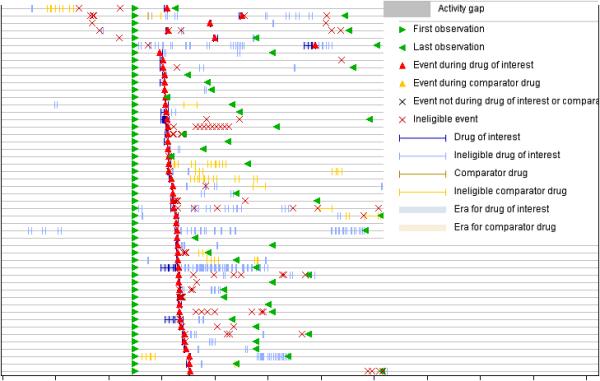
Patient timelines used to visualize and analyze healthcare data in drug safety. Each patient is represented by a horizontal line capturing time, and symbols on the line represent clinical events, e.g., diagnoses, test results, treatments, and drug eras. The figure shows timelines of patients experiencing various events such as headache (red triangle) within eligible periods of acetaminophen administration. The patients are sorted according to the first occurrence of an event (red triangle).