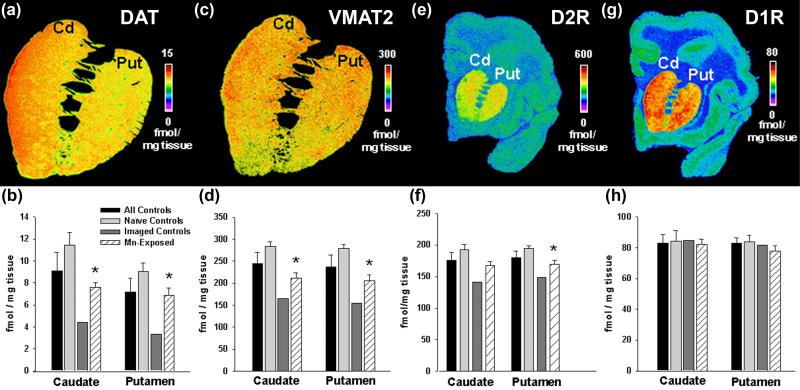
Figure 4.
Quantitative autoradiography of DAT (panels A and B), VMAT2 (panels C and D), D2R (panels E and F), and D1R (panels G and H). Panels A, C, E and G depict a pseudocolor image that shows specific binding of the relevant radioligand in a control animal (animal #123-146) at the rostral level of the caudate and putamen. Below each image (panels B, D, F and H), densitometry is shown for each group of animals. The data shows that DAT and VMAT2 are statistically significantly reduced (p*<0.05, Student’s t-test) in the Mn-exposed animals relative to naïve controls in the caudate and putamen. D2R levels in Mn-exposed animals were significantly reduced only in the putamen compared to controls. However, the imaged-controls displayed consistently lower levels of DAT, VMAT2 and D2R than did the Mn-exposed animals. D1 receptor levels did not change in any of the animal groups. Black bars represent controls (naïve + imaged controls); light grey, naïve controls; dark grey, imaged controls; striped, Mn-exposed. Each value is the mean ± sem of n=6 (controls), n=4 (naïve controls), n=2 (imaged controls), and n=8 (Mn-exposed, DAT), n=9 (Mn-exposed, VMAT2), n=11 (Mn-exposed, D1R).

