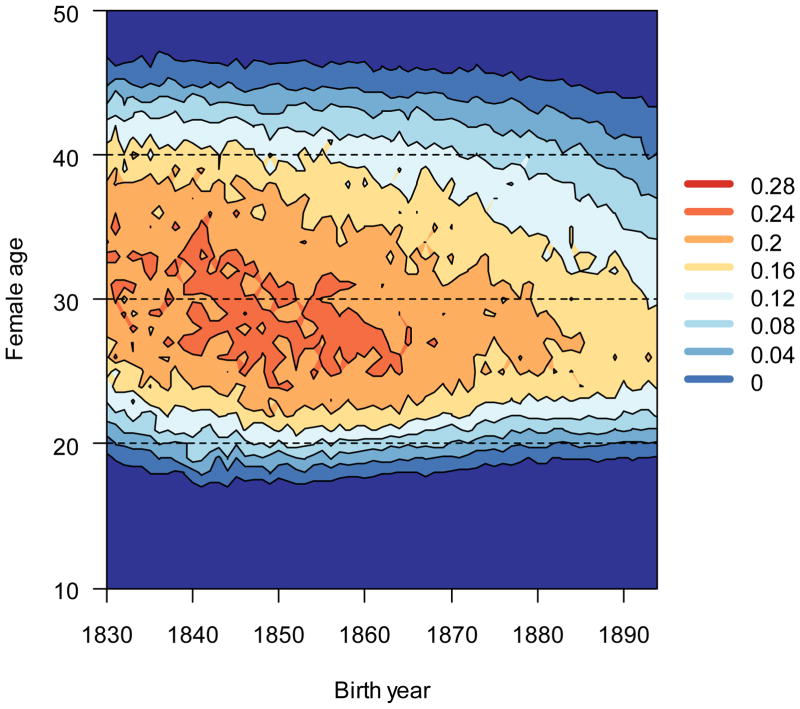
Figure 2.
Age-specific reproductive rates declined over time. Dark shades (warm) indicate high reproductive rates, and light shades (cool) indicate low reproductive rates. Reductions in age-specific reproduction with time (a fertility transition) are visualized as isoclines that decrease on the y axis (age) with increased birth year x.

