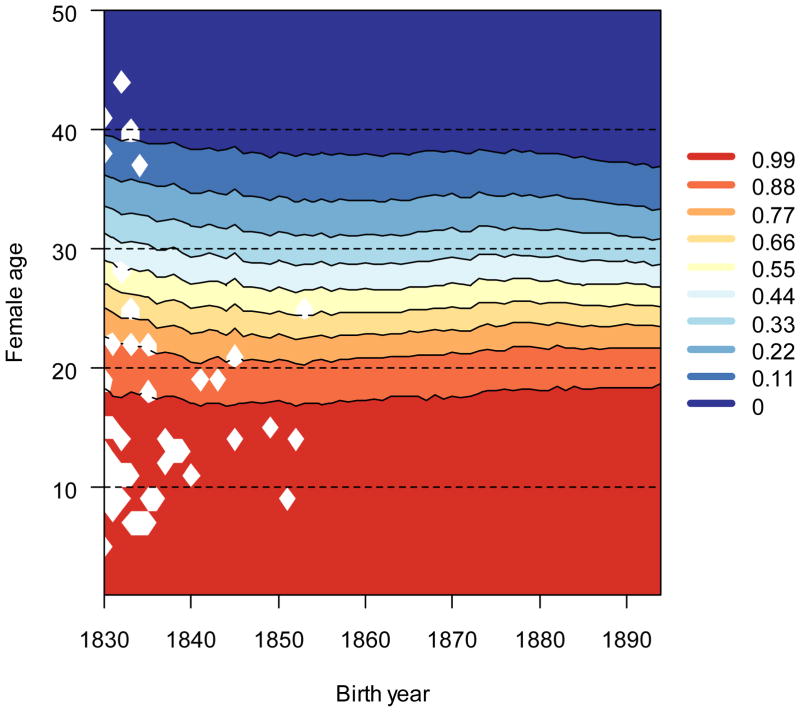
Figure 4.
Selection for age-specific survival changed slightly over time. Sensitivities, the product of the selection gradients derived from multivariate regression and cumulative survival rates, are presented here. Dark shades (warm) indicate high sensitivities, and light shades (cool) indicate low sensitivities. White values represent ages at which no deaths were recorded.

