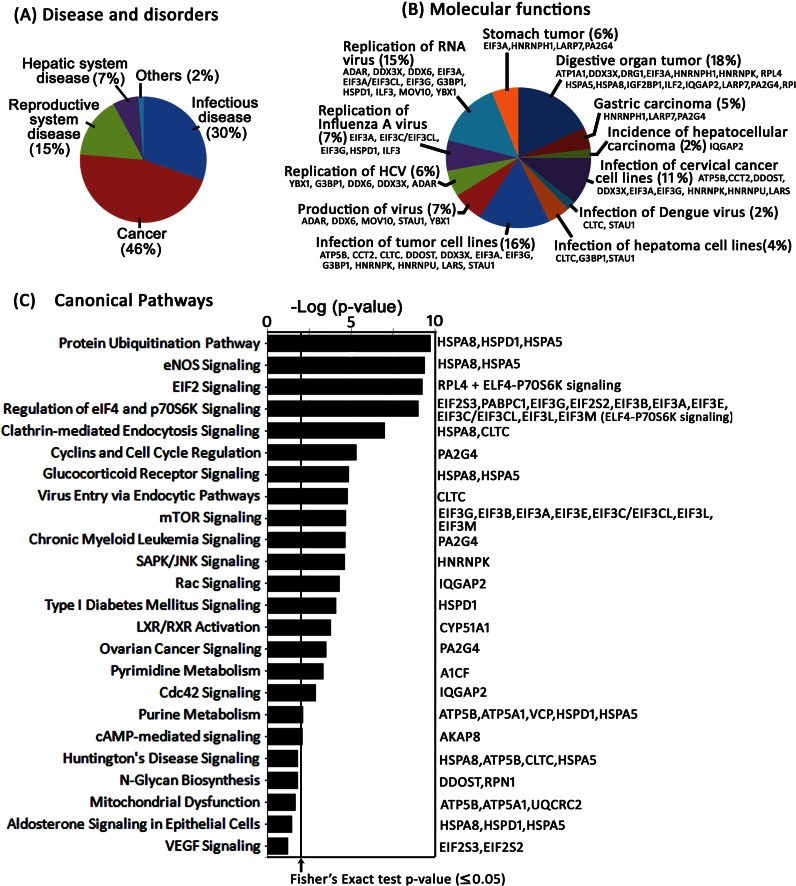
Fig. 6.
Bioinformatics analysis of the identified proteins. The affinity-captured proteins identified by LC/MS/MS were matched against the Ingenuity pathway database of disease and disorder (A), molecular function (B), and canonical pathways (C) that were most significant to the set of identified proteins. The canonical pathway of the identified proteins with a p value for each pathway is indicated by the bar and is expressed as −1 times the log of the p value. The line indicated with the arrow represents the ratio of the number of genes in a given pathway that meet the cutoff criterion (p ≥ 0.05) divided by the total number of genes that make up that pathway due to chance alone. The percent of total protein matched in each category in the dataset of disease and disorder and molecular function is indicated. The gene symbol of each protein that matched against molecular function (B) and individual pathway (C) is also shown.

