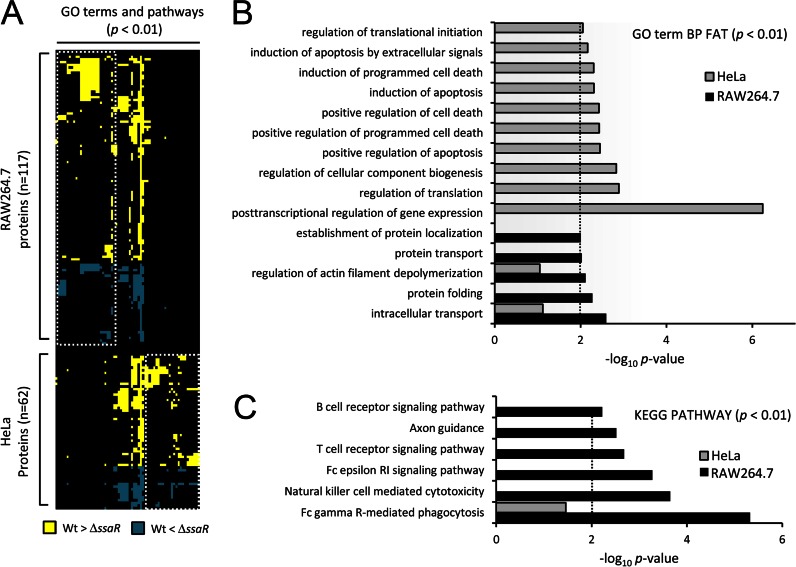
Fig. 2.
Host cell-specific modulation of cellular processes and pathways. A, heatmap of the GO terms and KEGG pathways enriched (p < 0.01, columns) among the host proteins showing significant phosphorylation changes (rows). Gene enrichment analysis was done using DAVID (23). Where an intersection point is colored, it indicates that that term or pathway is assigned to the particular protein. Yellow or blue represents increased phosphorylation in WT Salmonella or in ΔssaR Salmonella, respectively. White dashed boxes demark terms and pathways specific to either RAW264.7 or HeLa. B and C, plots of the log10 (p values) for some of the most highly enriched GO terms and KEGG pathways that correspond to columns in A (representative terms, i.e. GO term BP FAT and KEGG pathway, were shown, and results for all terms and pathways may be found in supplemental Fig. S2). The dashed line represents an arbitrary cutoff of p < 0.01).

