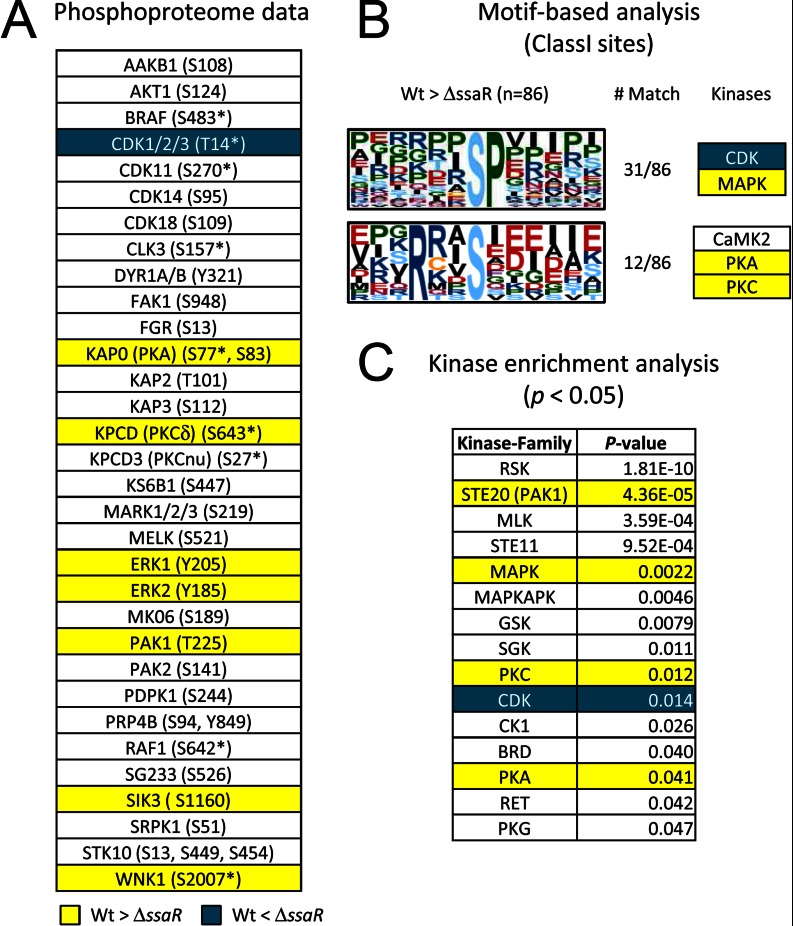
Fig. 3.
Protein kinase profiling in RAW264.7. A, protein kinases quantified in this study. Asterisks represent ambiguous phosphorylation sites (i.e. class II or class III sites where the fragments detected are insufficient to assign the specific residue that is phosphorylated). Yellow and blue coloring indicates kinases that show phosphorylation increases in WT Salmonella and in ΔssaR Salmonella, respectively. B, phosphorylation sequence motifs extracted from SPI2-regulated phosphosites by the Motif-X algorithm (24). C, protein kinase families enriched from SPI2-regulated phosphoproteins (substrates). These kinases were extracted based on a mammalian kinase-substrate database using kinase enrichment analysis tool (25).

