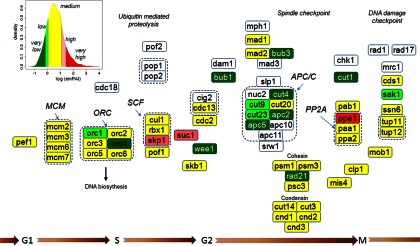
Fig. 3.

Abundance distribution of cell cycle proteins. Proteins were mapped to the cell cycle pathway according to the KEGG database together with their abundance classes determined from the analysis of unsynchronized proliferating cells (Fig. 1A, Experiment 2). Proteins not identified in the PeptideAtlas are indicated in white.
