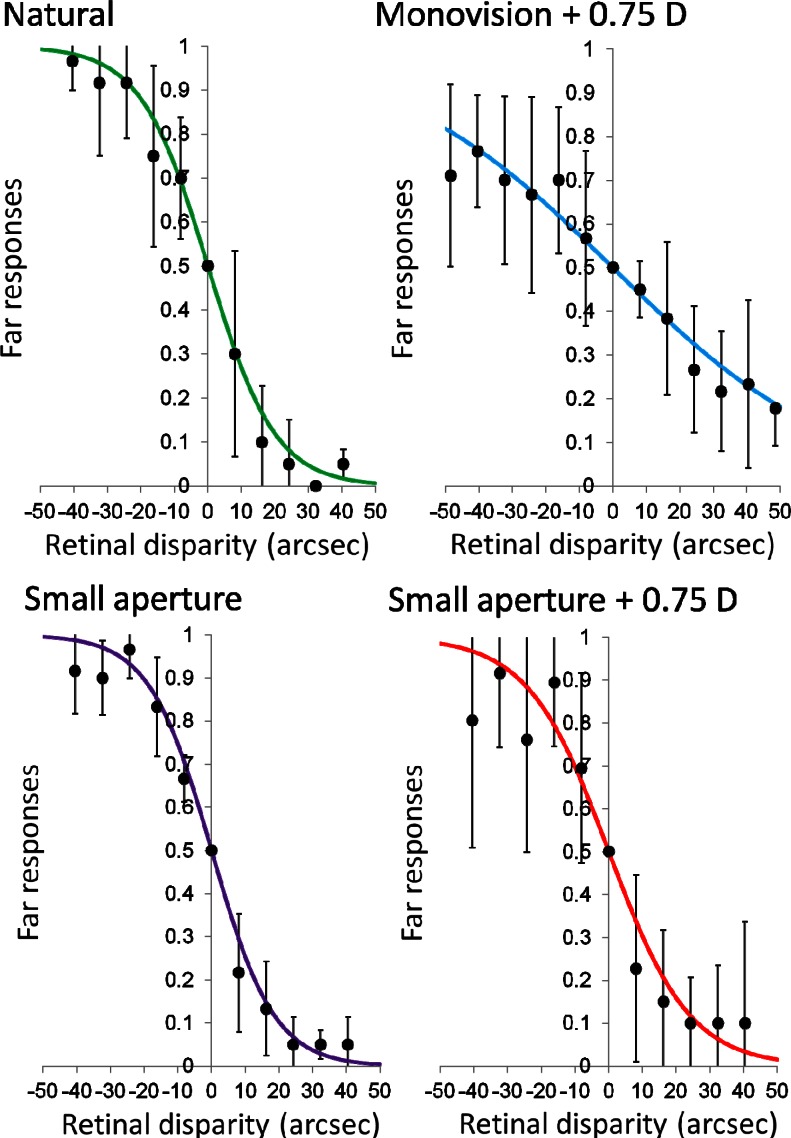
Fig. 2.
The solid points represent the mean value of far responses from 4 subjects for the three-needle test using a two-alternative forced-choice test. Error bars are the standard deviation. The solid lines are the least squares fitted psychometric curves. The right panels correspond to natural viewing, while the left ones present the results obtained under monovision with 0.75 D. At the bottom, the right panel corresponds to the case of vision with a small aperture in one of the eyes. The left panel presents the results obtained with a small aperture in combination with a monovision of 0.75 D in the same eye.

